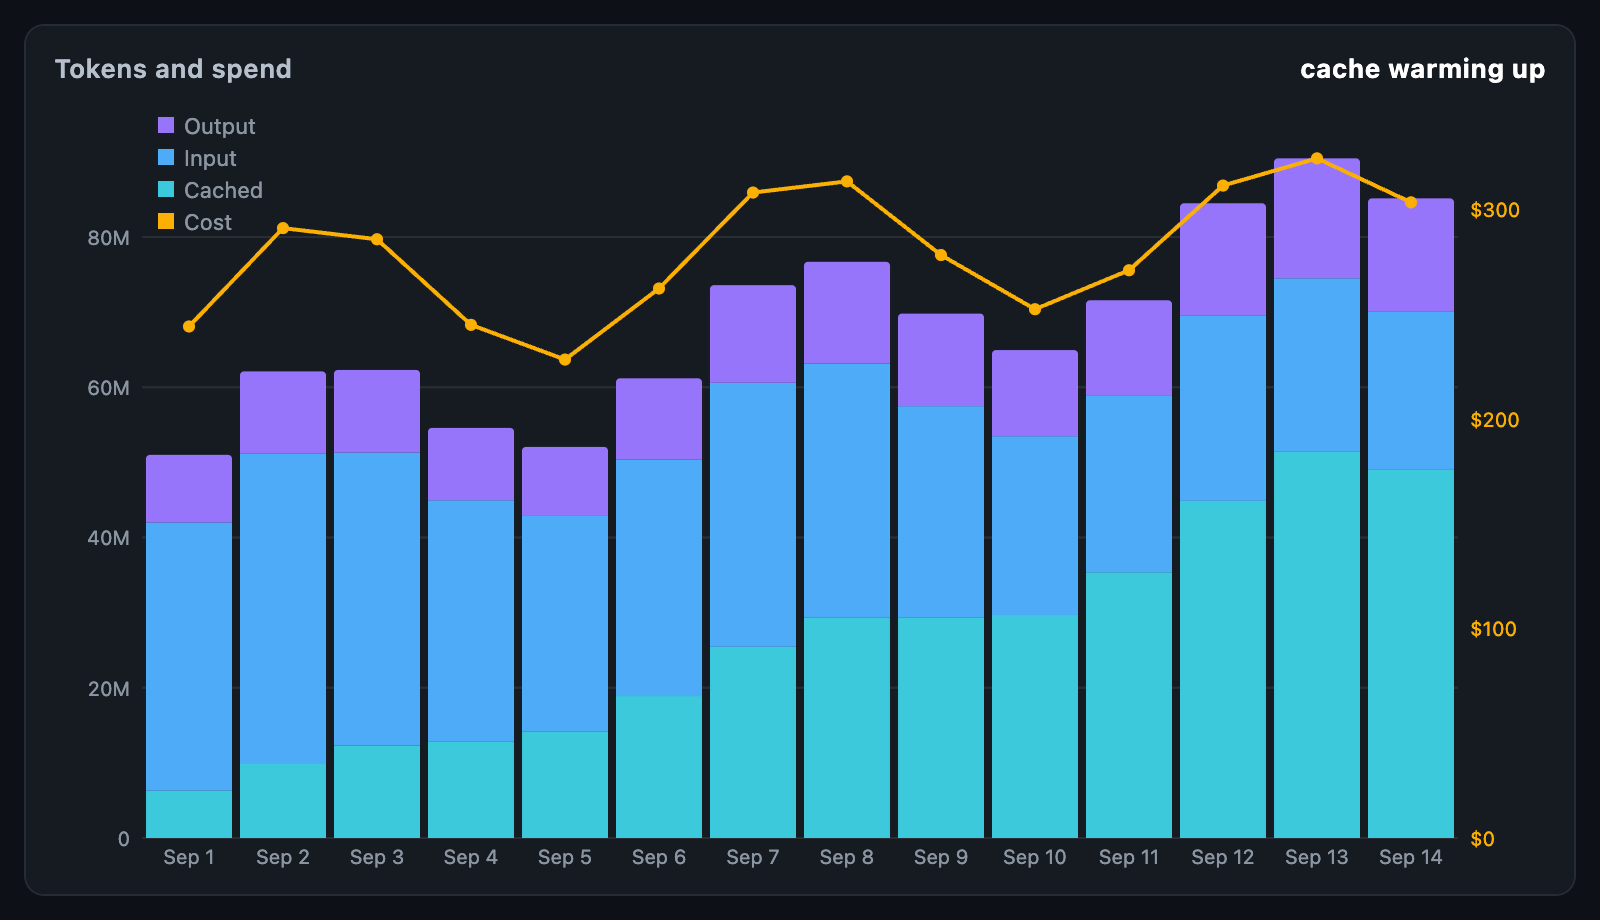
TokenUsageChart shows what a model served over time: tokens as stacked
columns — cached, input and output — and the cost as a line against its
own axis on the right. The cached share, the part of the prompt that was a cache
read, is its own colour because it is cheaper and faster than the rest.
TokenUsageChart(
  buckets: [
    for (final d in days)
      UsageBucket(
        time: d.date,
        inputTokens: d.prompt,
        outputTokens: d.completion,
        cachedTokens: d.cacheRead,
        cost: d.dollars,
      ),
  ],
  costFormatter: (v) => '\$${v.toStringAsFixed(0)}',
);
The chart fills its constraints. When the height is unbounded, it uses
defaultHeight.
| Field | Description |
|---|---|
time |
When the interval began; columns are evenly spaced in the order given |
inputTokens |
Prompt tokens processed |
outputTokens |
Tokens generated |
cachedTokens |
Prompt tokens served from a cache — counted apart from inputTokens, not inside it |
cost |
What the interval cost; null draws no point |
A value that is not finite, or negative, counts as zero. total is the sum of
the three kinds and cacheHitRate is cached over the whole prompt.
| Function | Description |
|---|---|
usageTotals(buckets) |
input, output, cached, tokens, cost and cacheHitRate over all of them |
compactCount(value) |
950, 12.4k, 3.1M, 2B — the default axis format |
| Parameter | Description |
|---|---|
showCost, costColor, costFormatter |
The cost line and its right-hand axis; omitted when no bucket has a cost |
inputColor, outputColor, cachedColor |
The stack |
barSpacing, barRadius |
Column gap and the rounding of the top |
tokenFormatter, timeFormatter, axisLabelStyle, gridColor |
Axes |
showLegend, legendStyle |
The series, in the corner |
onTouch reports a UsageTouchDetails with the bucket's index and bucket,
and null when the pointer leaves. tooltipBuilder builds a card beside the
column.