Summary
Add a local, browser-based Developer Web UI to the AgentCore CLI — a visual counterpart to agentcore dev, similar in spirit to the Google ADK adk web developer UI. It would let developers chat with any agent in their project, hold multiple persistent sessions, and watch tool calls, sub-agent delegation, reasoning, token usage and cost stream live in the browser — no deployment required.
Today the fastest way to exercise an agent locally is the terminal (agentcore dev / agentcore invoke). That's great for quick checks, but it's hard to inspect how a multi-tool, multi-agent run actually behaved: which tools were called, in what order, with what inputs/outputs, which ones failed, and what it cost. A browser UI makes that inspectable at a glance.
Motivation
- Faster local iteration — pick an agent, chat, and re-run without wiring up scripts.
- Observability while developing — see the live tool log and a per-response trace instead of scrolling raw stdout.
- Debuggability — failed tool calls (timeouts, bad SQL, missing columns) are visible with their exact input/output.
- Cost/perf awareness — latency, in/out tokens, cycles, tool-call count, model id and estimated cost per response.
- Parity with other agent frameworks — developers coming from Google ADK expect a
web dev surface.
Proposed capabilities
A new agentcore web command launches a FastAPI + SSE server on localhost (default port 8502) and opens the browser. Reuses the same local credential resolution as agentcore dev.
Three-pane workspace:
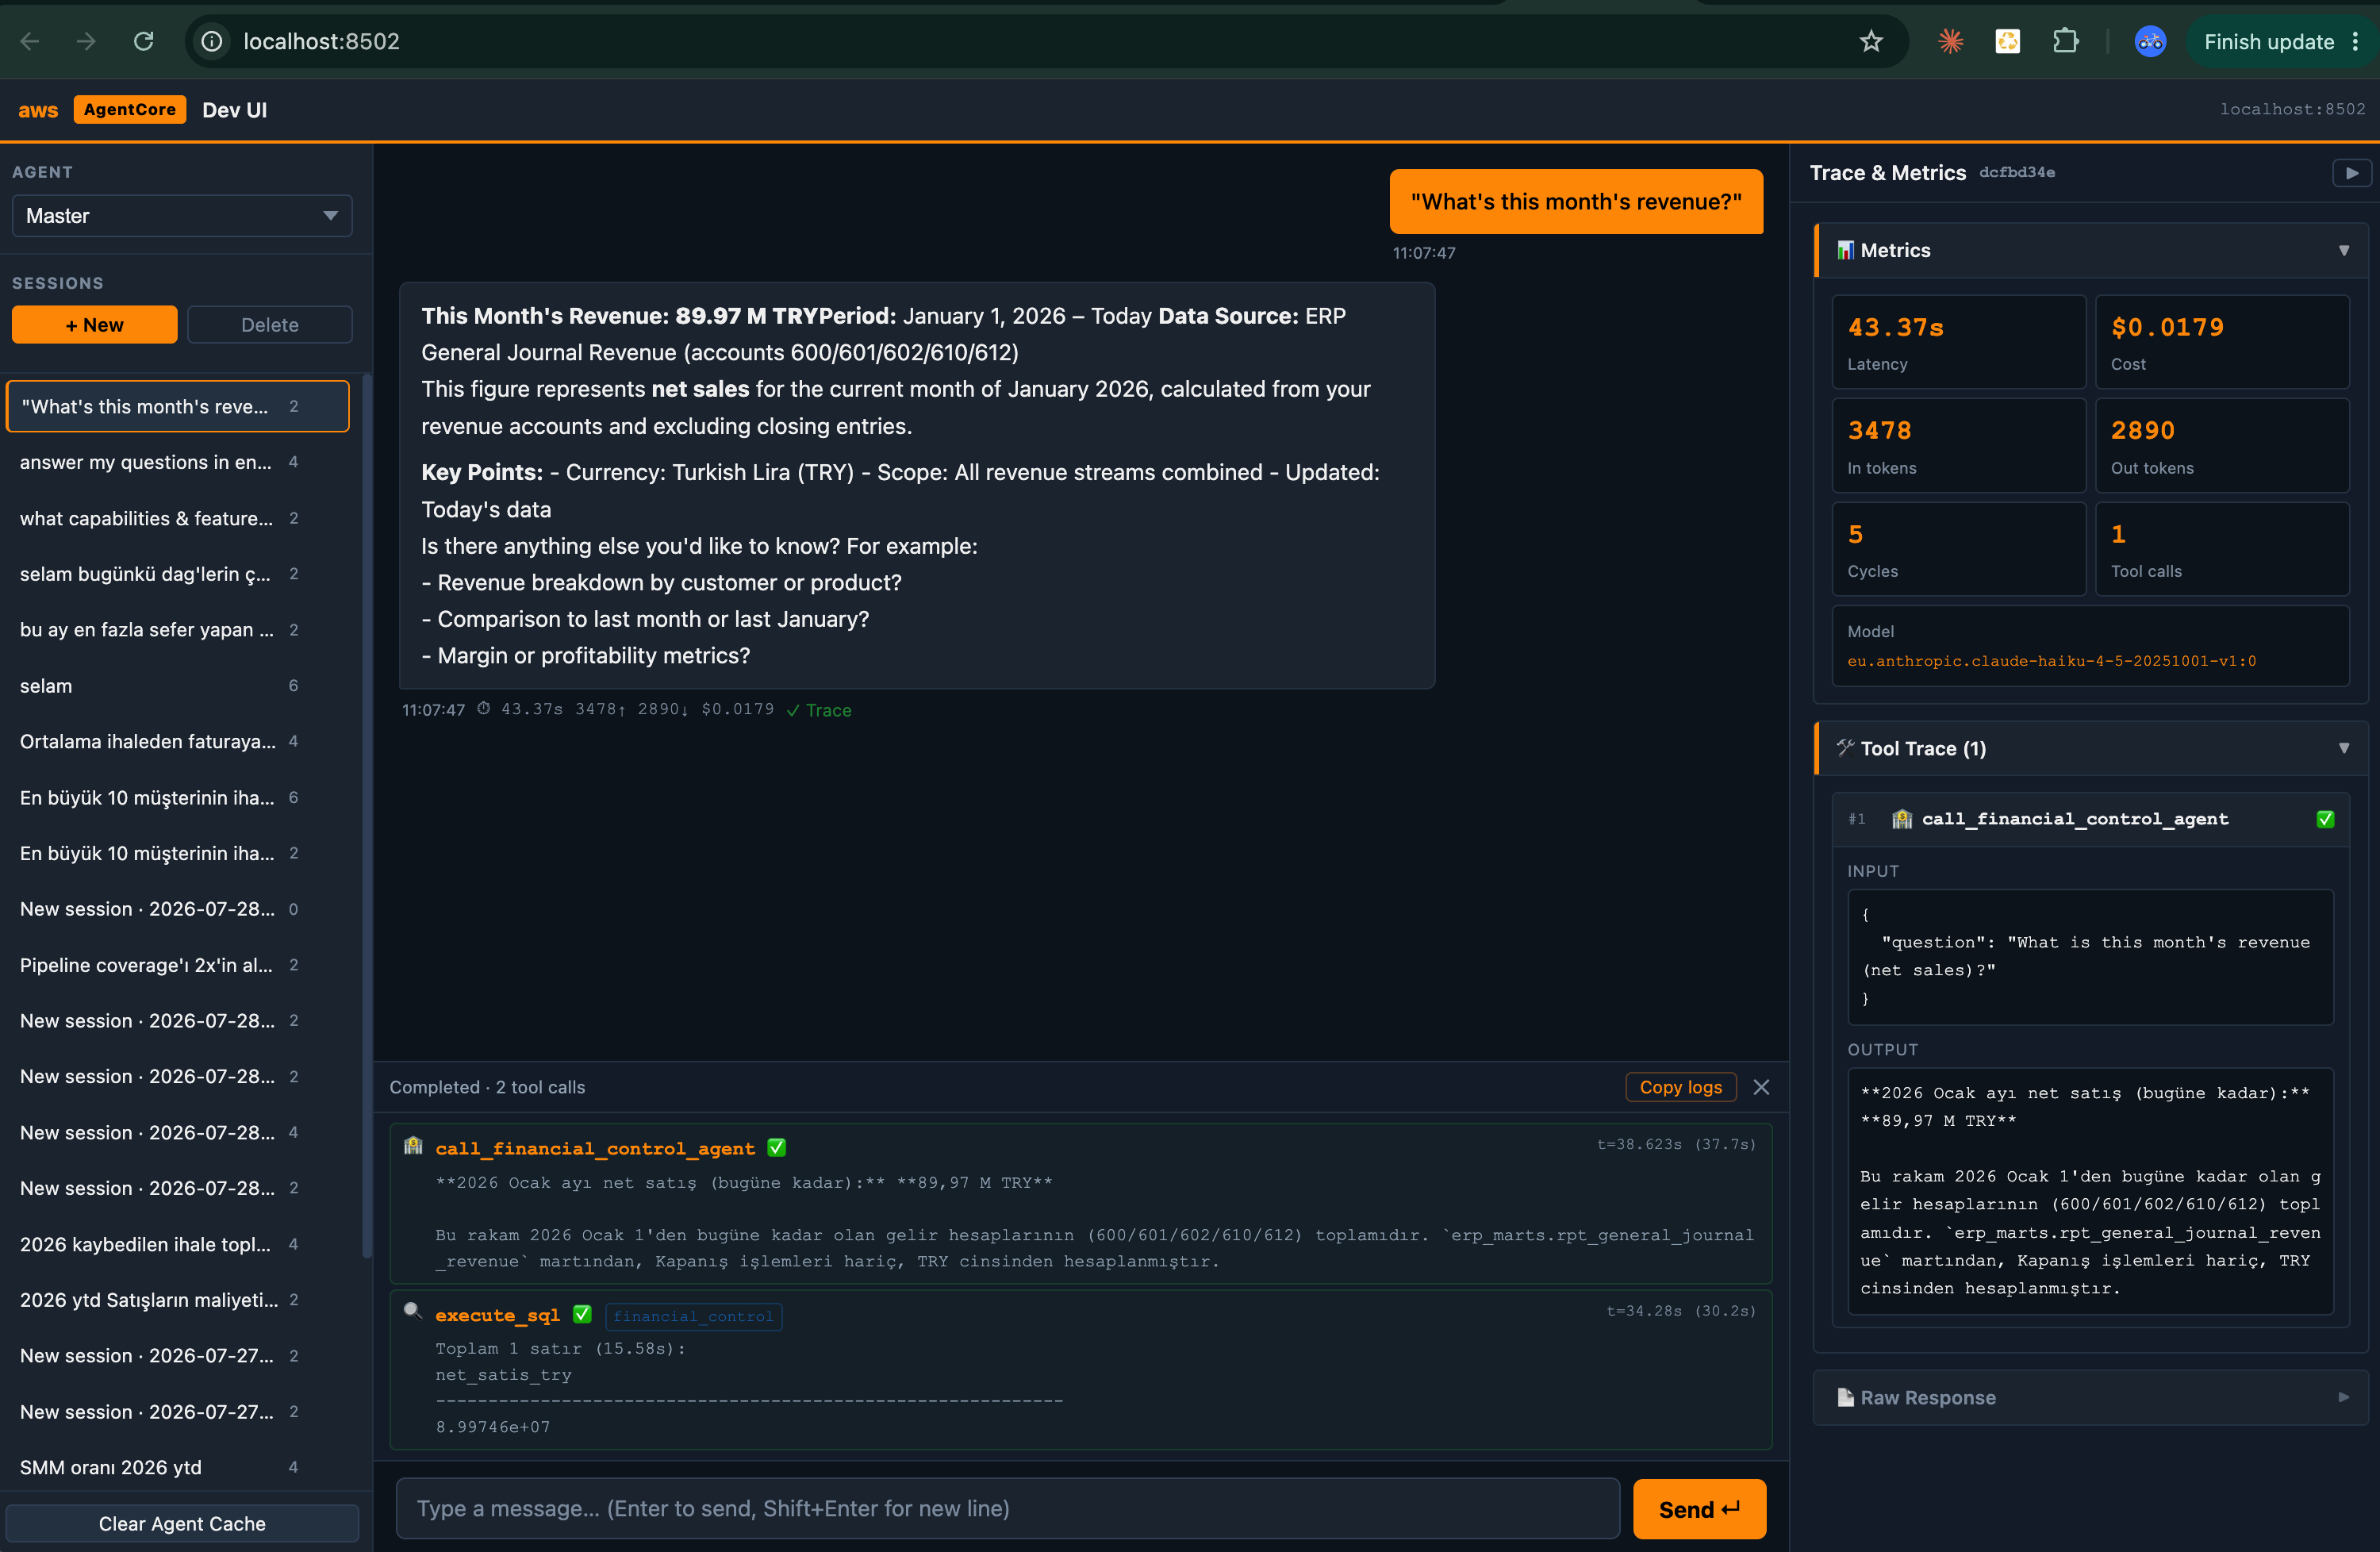
- Left — Agents & Sessions: agent picker, plus create/switch/delete of independent chat sessions (each keeps its own history), and a "Clear Agent Cache" action to reload agent code from disk after local edits.
- Center — Chat & live log: the conversation, with a live tool-call log that expands while a response streams and a "Copy logs" action for bug reports.
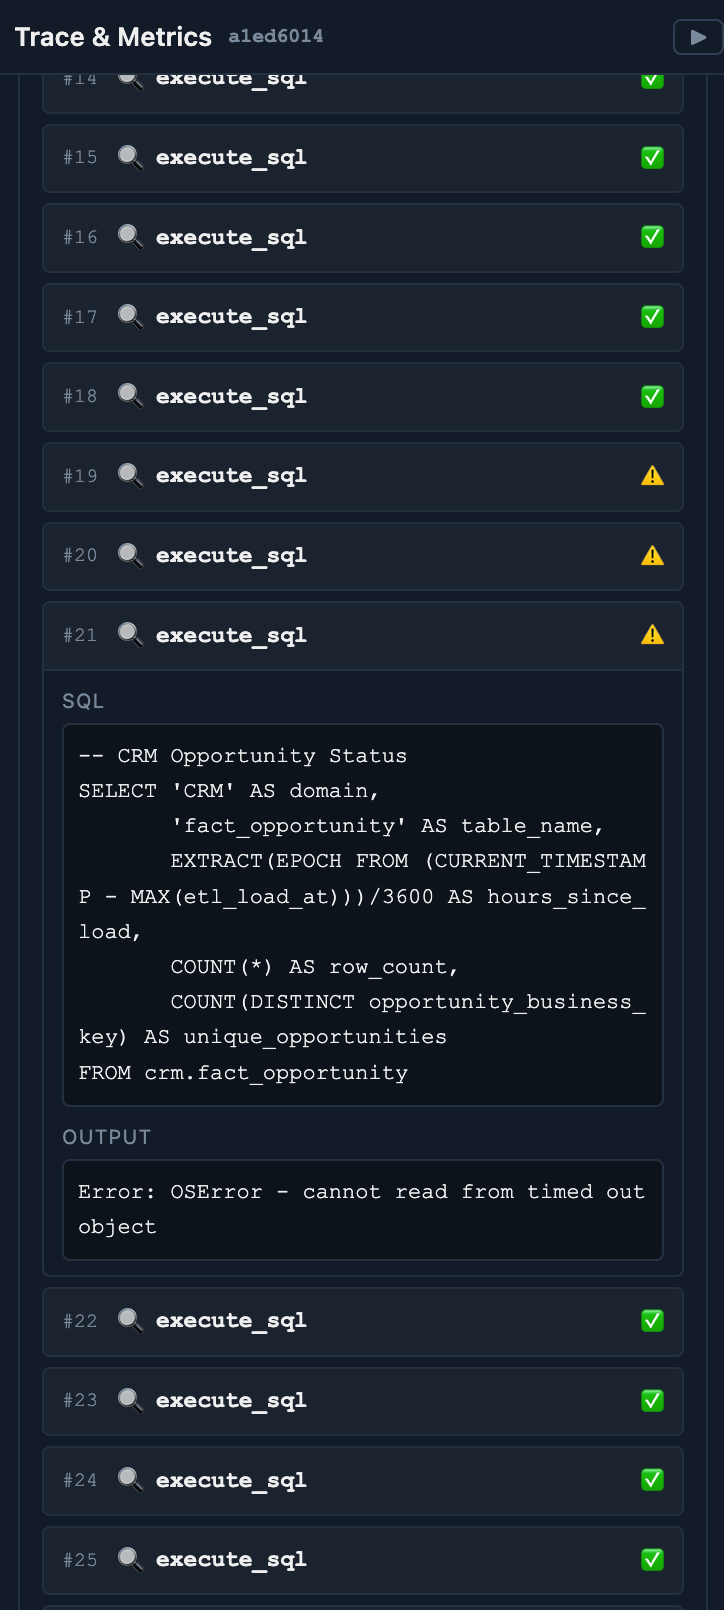
- Right — Trace & Metrics: per-response latency, cost, in/out tokens, cycles, tool-call count, model id, and an expandable ordered tool trace.
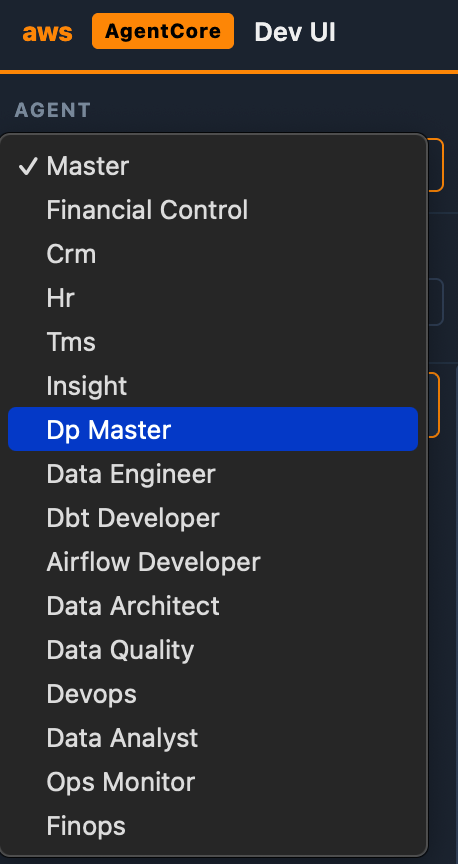
Agent selection — every agent in the project (including sub-agents) is selectable:
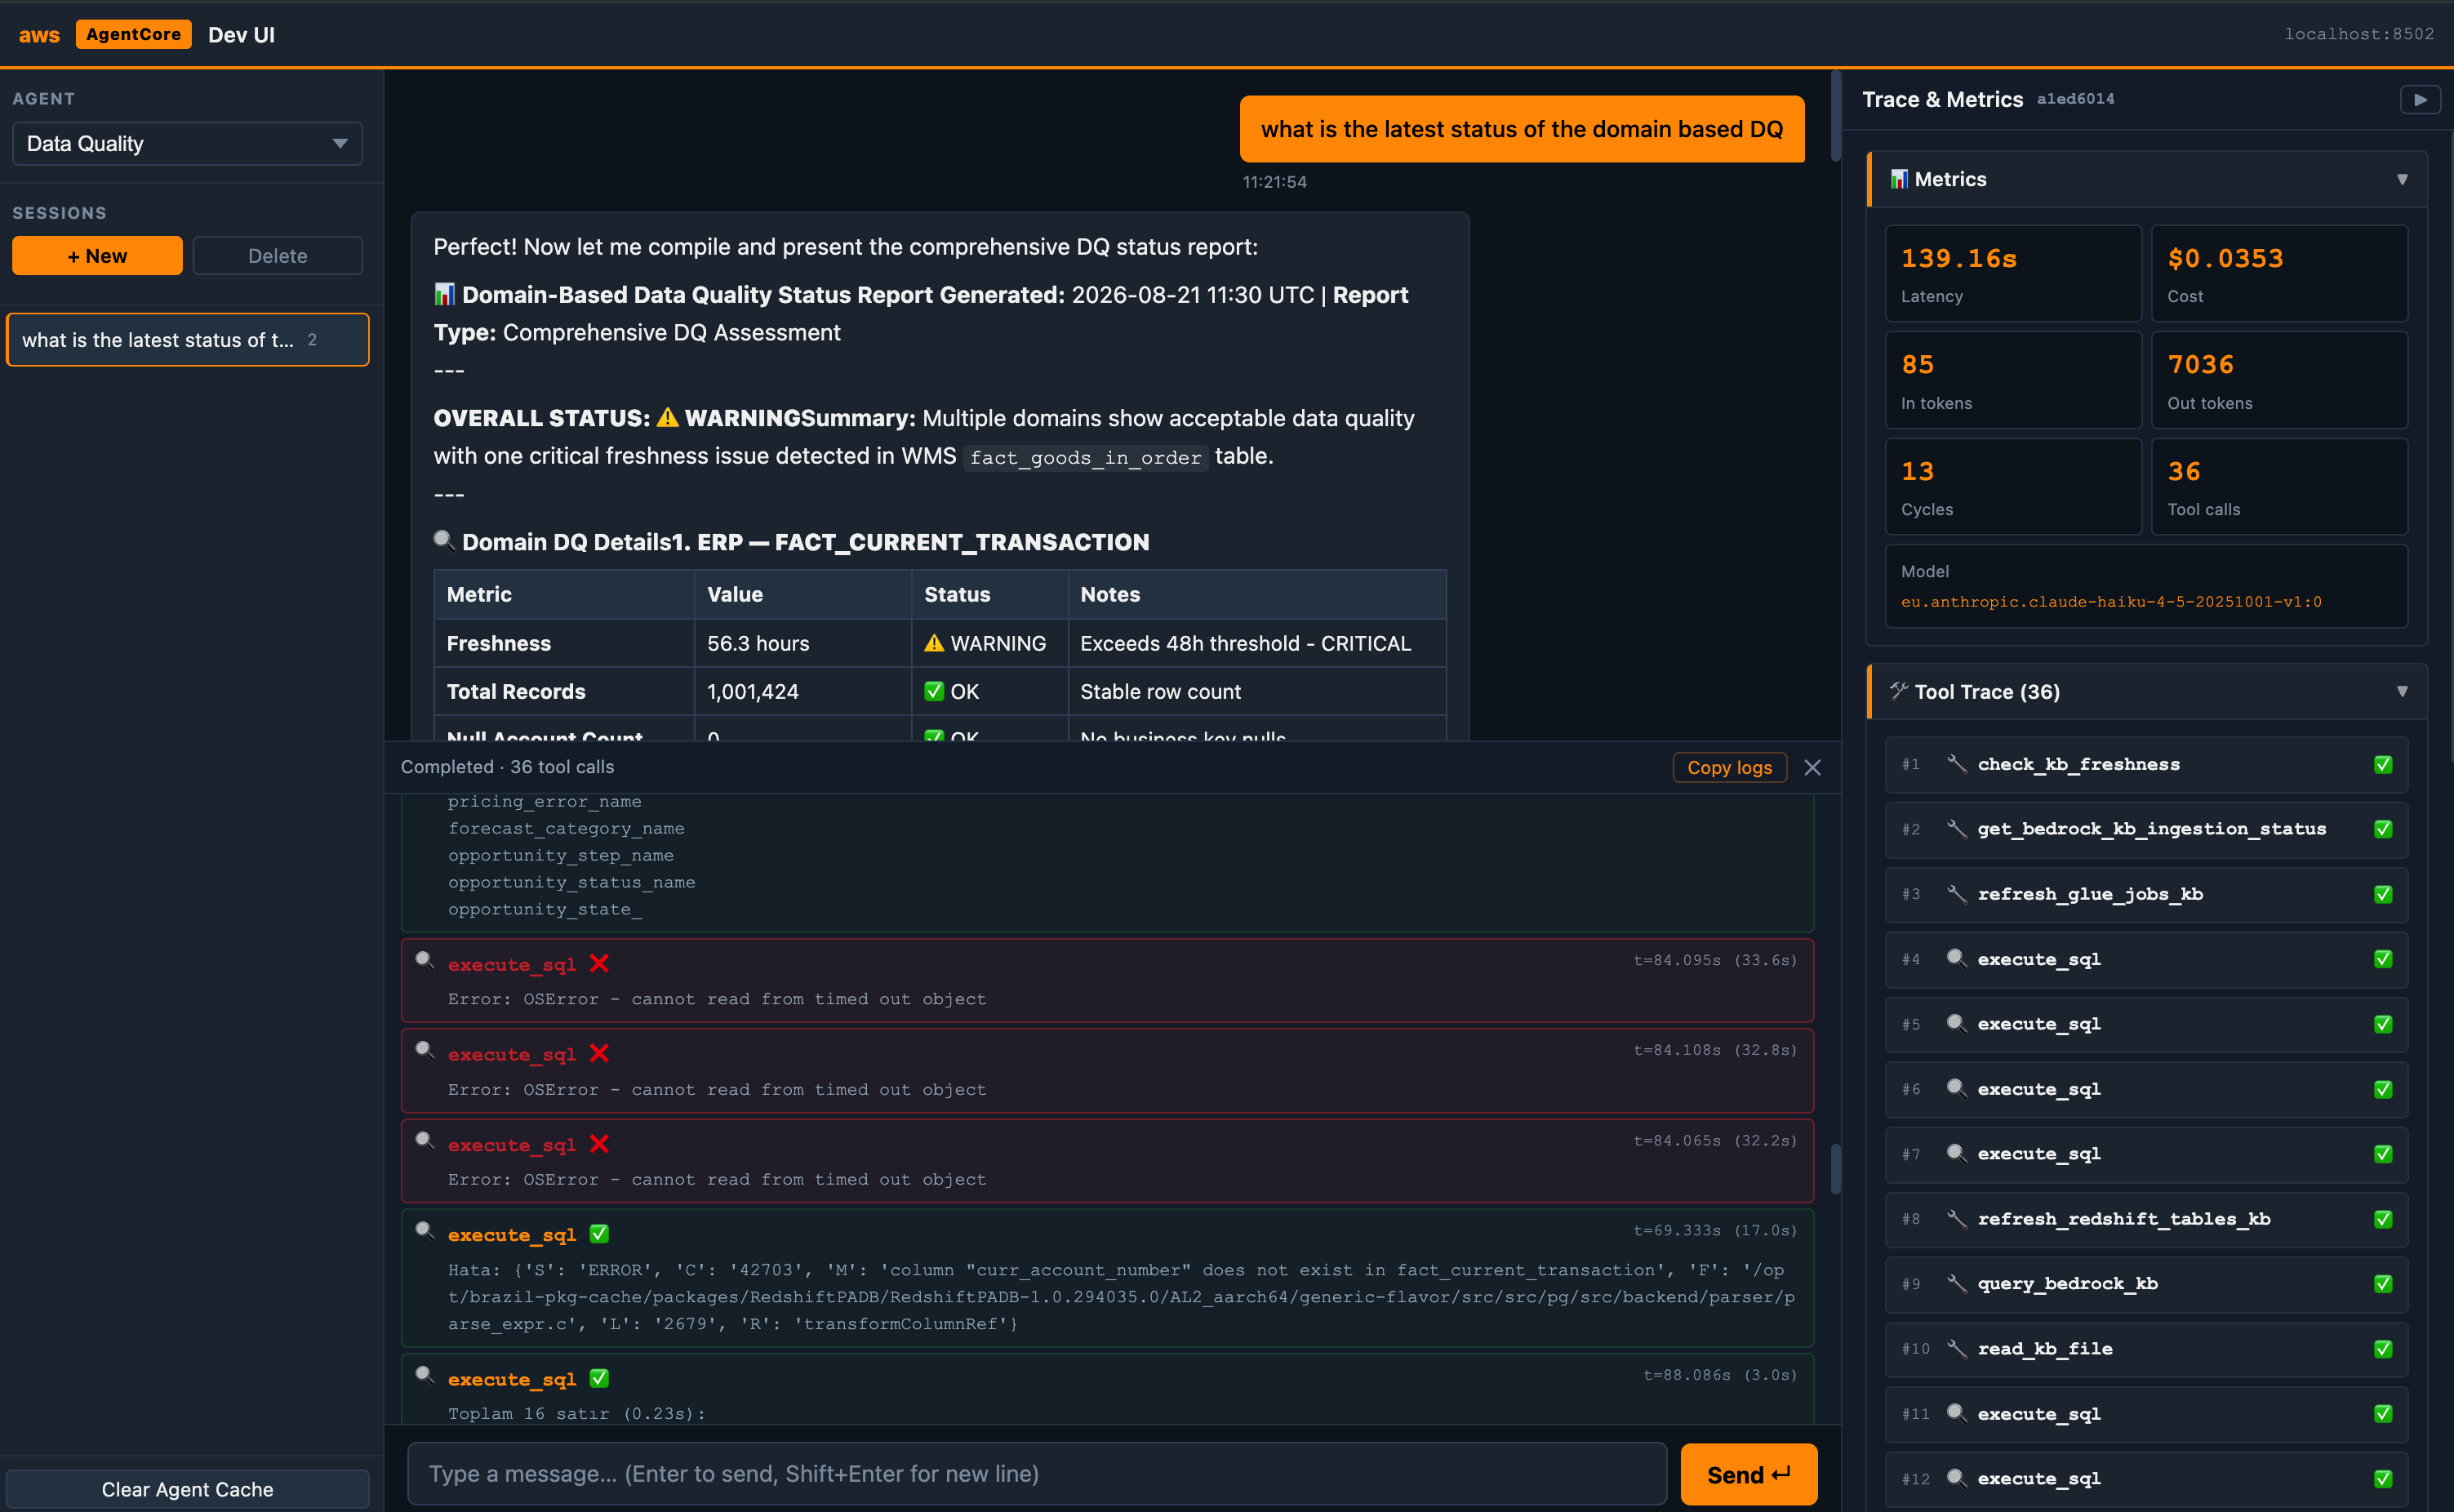
Live tool logs — each call shows a status icon (success / warning / error) and elapsed time, so failures are obvious mid-run:
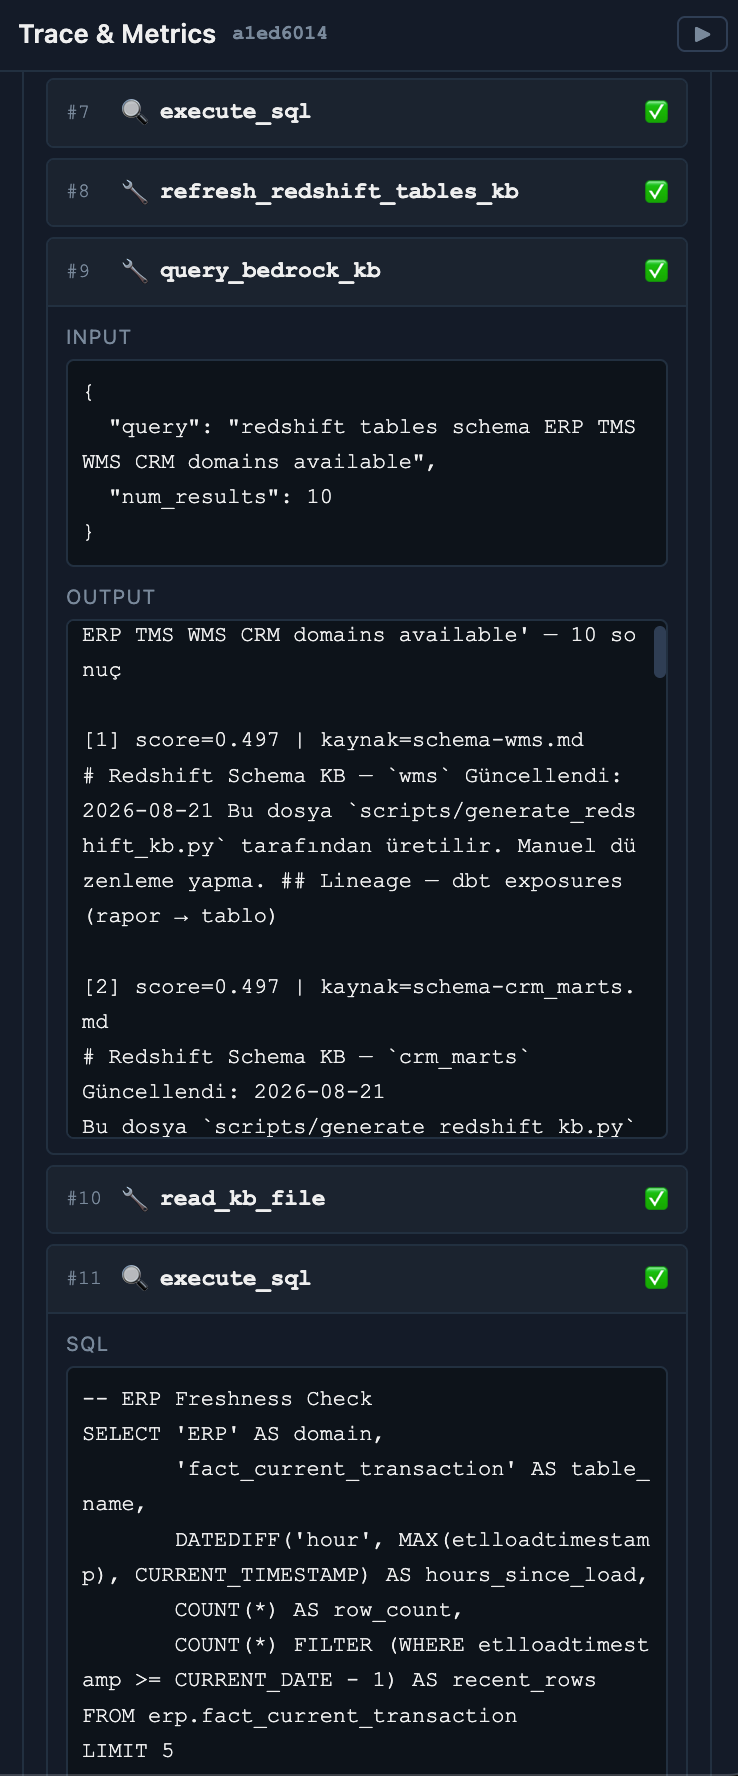
Trace inspection — expand any tool call to see its JSON input/output; SQL-backed tools render the exact SQL that ran:
| Input & output |
SQL executed |
 |
 |
Scope / non-goals
- Local development aid only — binds to
localhost, deploys nothing, and changes no AWS resources beyond invoking the developer's own agents.
- Not a production or hosted dashboard.
Acceptance criteria
Happy to contribute the implementation (a working prototype exists on a branch).
Summary
Add a local, browser-based Developer Web UI to the AgentCore CLI — a visual counterpart to
agentcore dev, similar in spirit to the Google ADKadk webdeveloper UI. It would let developers chat with any agent in their project, hold multiple persistent sessions, and watch tool calls, sub-agent delegation, reasoning, token usage and cost stream live in the browser — no deployment required.Today the fastest way to exercise an agent locally is the terminal (
agentcore dev/agentcore invoke). That's great for quick checks, but it's hard to inspect how a multi-tool, multi-agent run actually behaved: which tools were called, in what order, with what inputs/outputs, which ones failed, and what it cost. A browser UI makes that inspectable at a glance.Motivation
webdev surface.Proposed capabilities
A new
agentcore webcommand launches a FastAPI + SSE server onlocalhost(default port 8502) and opens the browser. Reuses the same local credential resolution asagentcore dev.Three-pane workspace:
Agent selection — every agent in the project (including sub-agents) is selectable:
Live tool logs — each call shows a status icon (success / warning / error) and elapsed time, so failures are obvious mid-run:
Trace inspection — expand any tool call to see its JSON input/output; SQL-backed tools render the exact SQL that ran:
Scope / non-goals
localhost, deploys nothing, and changes no AWS resources beyond invoking the developer's own agents.Acceptance criteria
agentcore web [--port <n>]starts the UI, auto-selecting a free port if the default is busy, and opens the browser.uvicornis missing.Happy to contribute the implementation (a working prototype exists on a branch).