Skip to content

fix(security): mark the parseJSON-filled extracted map as a reviewed Semgrep false positive - #788

Merged
szibis merged 1 commit into
mainfrom
fix/semgrep-empty-map-false-positive
Oct 21, 2026
Merged

szibis merged 1 commit into
mainfrom
fix/semgrep-empty-map-false-positive

Conversation

@szibis

@szibis szibis commented Oct 21, 2026

Copy link
Copy Markdown
Collaborator

Summary

Code-scanning alert 607 (Semgrep OSS, trailofbits.go.iterate-over-empty-map) flags the for name := range extracted loop in unwrapParseLine (internal/proxy/unwrap_conversion_error.go). The map is filled by plan.parseJSON(line, before, labels, extracted) on the line before the loop, so the finding is a false positive.

Change

An inline // nosemgrep: trailofbits.go.iterate-over-empty-map.iterate-over-empty-map -- parseJSON fills it before the loop below on the map's declaration, the line Semgrep anchors the finding to, following the repository's existing reviewed exceptions (otlp.go, patterns.go, proxy.go, quantile_histogram.go). No code or behaviour change. Passing parsed to parseJSON directly was considered and rejected: it would also skip names an earlier parser stage extracted, which changes the result.

Proof

Semgrep 1.161.0 (the version the scheduled security workflow pins) with p/default p/golang p/owasp-top-ten:

file findings
main iterate-over-empty-map:970, no-direct-write-to-responsewriter:1187 (excluded in CI)
this branch no-direct-write-to-responsewriter:1187 (excluded in CI)

go build, changelog gate. The alert closes when the scheduled Semgrep run scans main after merge.

Not applicable: no behaviour change, so e2e vs Loki, the Grafana range matrix, visual proof, A/B, benchstat and the load test do not apply.

…Semgrep false positive

Semgrep's trailofbits.go.iterate-over-empty-map flags the range over
extracted in unwrapParseLine, but plan.parseJSON fills the map before the
loop. Mark the declaration with an inline nosemgrep and the reason, like
the repository's other reviewed Semgrep exceptions. No behaviour change.
@github-actions github-actions Bot added size/S Small change scope/proxy Proxy core scope/docs Documentation bugfix Bug fix labels Oct 21, 2026
@szibis
szibis merged commit bd8e3b3 into main Oct 21, 2026
29 checks passed
@szibis
szibis deleted the fix/semgrep-empty-map-false-positive branch October 21, 2026 13:14
@github-actions

Copy link
Copy Markdown
Contributor

⚪ Performance A/B: no change beyond noise

65 shape×range — 65 ⚪ same · results vs Loki: 51 same, 0 new difference(s), 14 pre-existing

Every shape is within noise of the base build (±30% and 100 ms).

65 unchanged shape×range (within noise)
shape range base p50 PR p50 change Loki p50 PR ÷ Loki result vs Loki
⚪ drilldown service landing 1h 34 ms 32 ms ⚪ -6% 36 ms 0.89× ✅ same
⚪ instant json filtered instant 11 ms 10 ms ⚪ -9% 81 ms 0.12× ✅ same
⚪ instant json volume instant 35 ms 34 ms ⚪ -3% 114 ms 0.30× ✅ same
⚪ instant ungrouped rate instant 6 ms 6 ms ⚪ +0% 82 ms 0.07× ✅ same
⚪ json rate by level (no filter, no drop) 1h 400 400 ⚪ +0% 400 — ✅ same
⚪ json volume no filters 1h 211 ms 270 ms ⚪ +28% 59 ms 4.58× ✅ same
⚪ logs plain 1h 65 ms 66 ms ⚪ +2% 44 ms 1.50× ✅ same
⚪ logs | json 1h 94 ms 93 ms ⚪ -1% 75 ms 1.24× ✅ same
⚪ stream-label count by app 1h 34 ms 27 ms ⚪ -21% 56 ms 0.48× ✅ same
⚪ topk rate by app 1h 50 ms 46 ms ⚪ -8% 100 ms 0.46× ➖ differs (as base)
⚪ X1 json filter level_extracted, by level 1h 415 ms 390 ms ⚪ -6% 85 ms 4.59× ✅ same
⚪ X2 json group by level_extracted 1h 323 ms 318 ms ⚪ -2% 59 ms 5.39× ✅ same
⚪ X3 json rate, level_extracted equality 1h 279 ms 297 ms ⚪ +6% 48 ms 6.19× ✅ same
⚪ X4 json bytes, level_extracted regexp 1h 404 ms 416 ms ⚪ +3% 137 ms 3.04× ✅ same
⚪ X5 logfmt filter level_extracted, by level 1h 675 ms 679 ms ⚪ +1% 64 ms 11× ✅ same
⚪ E1 logs, json parser over stream labels 1h 129 ms 124 ms ⚪ -4% 66 ms 1.88× ✅ same
⚪ E2 logs, logfmt parser over stream labels 1h 98 ms 106 ms ⚪ +8% 57 ms 1.86× ✅ same
⚪ E3 logs, json, existence filter on level_extracted 1h 157 ms 155 ms ⚪ -1% 77 ms 2.01× ✅ same
⚪ E4 logs, logfmt, existence filter on level_extracted 1h 98 ms 97 ms ⚪ -1% 61 ms 1.59× ✅ same
⚪ E5 logs, json, drop level_extracted 1h 124 ms 123 ms ⚪ -1% 64 ms 1.92× ✅ same
⚪ E6 logfmt count by level_extracted 1h 47 ms 47 ms ⚪ +0% 9 ms 5.22× ✅ same
⚪ E7 json count by level_extracted 1h 149 ms 149 ms ⚪ +0% 16 ms 9.31× ✅ same
⚪ E8 instant logfmt by level_extracted instant 7 ms 7 ms ⚪ +0% 10 ms 0.70× ✅ same
⚪ A explore volume, 2 filters, drop 1h 171 ms 175 ms ⚪ +2% 191 ms 0.92× ✅ same
⚪ B grouped sum, filter, no drop 1h 110 ms 106 ms ⚪ -4% 47 ms 2.26× ✅ same
⚪ C ungrouped sum, filter, no drop 1h 105 ms 104 ms ⚪ -1% 44 ms 2.36× ✅ same
⚪ D volume, no filters 1h 234 ms 243 ms ⚪ +4% 59 ms 4.12× ✅ same
⚪ F field breakdown service_version (explore) 1h 151 ms 153 ms ⚪ +1% 60 ms 2.55× ✅ same
⚪ H field breakdown service_version (drilldown) 1h 86 ms 82 ms ⚪ -5% 39 ms 2.10× ✅ same
⚪ I grafana volume of B 1h 106 ms 102 ms ⚪ -4% 45 ms 2.27× ✅ same
⚪ O2 explore log volume (Grafana form), underscore structured-metadata filter 1h 70 ms 69 ms ⚪ -1% 45 ms 1.53× ✅ same
⚪ DL2 drilldown field breakdown, level + stream-label filter before json 1h 48 ms 48 ms ⚪ +0% 9 ms 5.33× ✅ same
⚪ DL6 explore volume, level filter before json 1h 561 ms 552 ms ⚪ -2% 53 ms 10× ✅ sum ±0.31%
⚪ P1 logs, json, level equals 1h 128 ms 138 ms ⚪ +8% 87 ms 1.59× ✅ same
⚪ P2 logs, logfmt, level not equal 1h 34 ms 32 ms ⚪ -6% 7 ms 4.57× ✅ same
⚪ P3 logs, json, level existence 1h 133 ms 138 ms ⚪ +4% 72 ms 1.92× ✅ same
⚪ P4 logfmt count by level 1h 36 ms 35 ms ⚪ -3% 10 ms 3.50× ✅ same
⚪ P5 json count by level 1h 83 ms 82 ms ⚪ -1% 17 ms 4.82× ✅ same
⚪ P6 json count, level filter 1h 21 ms 17 ms ⚪ -19% 15 ms 1.13× ✅ same
⚪ P7 json rate by level, level regexp 1h 22 ms 19 ms ⚪ -14% 16 ms 1.19× ✅ same
⚪ P8 json count by a name that is no stream label 1h 91 ms 87 ms ⚪ -4% 16 ms 5.44× ✅ same
⚪ P9 instant logfmt by level instant 7 ms 6 ms ⚪ -14% 10 ms 0.60× ✅ same
⚪ E1 json duration_ms sum by service 1h 84 ms 91 ms ⚪ +8% 22 ms 4.14× ➖ differs (as base)
⚪ E2 json duration_ms p95 by service 1h 269 ms 268 ms ⚪ -0% 17 ms 16× ✅ same
⚪ E3 logfmt latency_ms rate, production 1h 508 ms 503 ms ⚪ -1% 169 ms 2.98× ➖ differs (as base)
⚪ E4 logfmt size_bytes max by service 1h 46 ms 46 ms ⚪ +0% 16 ms 2.88× ➖ differs (as base)
⚪ E5 json duration_ms sum, instant instant 38 ms 34 ms ⚪ -11% 28 ms 1.21× ✅ same
⚪ E6 logfmt ttl unit string (Loki 400) 1h 400 400 ⚪ +5% 400 — ✅ same
⚪ E7 json hexadecimal trace_id (Loki 400) 1h 400 400 ⚪ +2% 400 — ✅ same
⚪ E8 json duration_ms sum by service, namespace prod 1h 194 ms 192 ms ⚪ -1% 104 ms 1.85× ➖ differs (as base)
⚪ E9 logfmt latency_ms sum by service, namespace prod 1h 308 ms 310 ms ⚪ +1% 100 ms 3.10× ➖ differs (as base)
⚪ U1 json duration_ms sum by service 1h 83 ms 85 ms ⚪ +2% 22 ms 3.86× ➖ differs (as base)
⚪ U10 instant sum_over_time unwrap instant 34 ms 31 ms ⚪ -9% 29 ms 1.07× ✅ same
⚪ U11 instant max_over_time missing label instant 5 ms 5 ms ⚪ +0% 16 ms 0.31× ✅ same
⚪ U12 json duration_ms over every service 1h 262 ms 317 ms ⚪ +21% 66 ms 4.80× ➖ differs (as base)
⚪ U13 logfmt latency_ms over every service 1h 510 ms 499 ms ⚪ -2% 73 ms 6.84× ➖ differs (as base)
⚪ U14 duration() of a unit string 1h 45 ms 48 ms ⚪ +7% 7 ms 6.86× ➖ differs (as base)
⚪ U2 json duration_ms max by service 1h 104 ms 90 ms ⚪ -13% 50 ms 1.80× ➖ differs (as base)
⚪ U3 json duration_ms sliding sum 1h 82 ms 86 ms ⚪ +5% 39 ms 2.21× ➖ differs (as base)
⚪ U4 logfmt size_bytes sum by service 1h 40 ms 40 ms ⚪ +0% 9 ms 4.44× ➖ differs (as base)
⚪ U5 logfmt ttl unit string (no sample) 1h 39 ms 38 ms ⚪ -3% 7 ms 5.43× ✅ same
⚪ U6 missing label, no parser 1h 19 ms 19 ms ⚪ +0% 11 ms 1.73× ✅ same
⚪ U7 missing label, ungrouped sum 1h 17 ms 17 ms ⚪ +0% 11 ms 1.55× ✅ same
⚪ U8 rate of an unwrapped label 1h 95 ms 87 ms ⚪ -8% 17 ms 5.12× ✅ same
⚪ U9 bytes() conversion 1h 52 ms 54 ms ⚪ +4% 13 ms 4.15× ➖ differs (as base)
Cold (first-run) timings — what a user opening a panel sees
shape range base cold PR cold Loki cold PR ÷ Loki cold
drilldown service landing 1h 43 ms 37 ms 809 ms 0.05×
instant json filtered instant 11 ms 11 ms 80 ms 0.14×
instant json volume instant 35 ms 36 ms 109 ms 0.33×
instant ungrouped rate instant 6 ms 9 ms 78 ms 0.12×
json rate by level (no filter, no drop) 1h 400 400 400 —
json volume no filters 1h 208 ms 223 ms 911 ms ↺ 0.24×
logs plain 1h 77 ms 74 ms 59 ms 1.25×
logs | json 1h 109 ms 102 ms 57 ms 1.79×
stream-label count by app 1h 26 ms 27 ms 828 ms 0.03×
topk rate by app 1h 50 ms 50 ms 910 ms 0.05×
X1 json filter level_extracted, by level 1h 3.59 s 3.56 s 889 ms 4.00×
X2 json group by level_extracted 1h 315 ms 300 ms 924 ms 0.32×
X3 json rate, level_extracted equality 1h 277 ms 281 ms 834 ms 0.34×
X4 json bytes, level_extracted regexp 1h 402 ms 407 ms 867 ms 0.47×
X5 logfmt filter level_extracted, by level 1h 936 ms 742 ms 1.10 s 0.67×
E1 logs, json parser over stream labels 1h 117 ms 119 ms 75 ms 1.59×
E2 logs, logfmt parser over stream labels 1h 77 ms 82 ms 67 ms 1.22×
E3 logs, json, existence filter on level_extracted 1h 161 ms 149 ms 80 ms 1.86×
E4 logs, logfmt, existence filter on level_extracted 1h 107 ms 108 ms 65 ms 1.66×
E5 logs, json, drop level_extracted 1h 121 ms 129 ms 65 ms 1.98×
E6 logfmt count by level_extracted 1h 46 ms 46 ms 41 ms 1.12×
E7 json count by level_extracted 1h 1.43 s 1.45 s 156 ms 9.27×
E8 instant logfmt by level_extracted instant 9 ms 7 ms 9 ms 0.78×
A explore volume, 2 filters, drop 1h 1.45 s 1.42 s 1.33 s 1.07×
B grouped sum, filter, no drop 1h 175 ms 148 ms 619 ms 0.24×
C ungrouped sum, filter, no drop 1h 127 ms 126 ms 647 ms 0.19×
D volume, no filters 1h 222 ms 218 ms 911 ms 0.24×
F field breakdown service_version (explore) 1h 1.39 s 1.39 s 821 ms 1.69×
H field breakdown service_version (drilldown) 1h 133 ms 125 ms 926 ms 0.13×
I grafana volume of B 1h 112 ms 111 ms 629 ms 0.18×
O2 explore log volume (Grafana form), underscore structured-metadata filter 1h 165 ms 151 ms 561 ms 0.27×
DL2 drilldown field breakdown, level + stream-label filter before json 1h 100 ms 94 ms 34 ms 2.76×
DL6 explore volume, level filter before json 1h 1.08 s 1.07 s 977 ms 1.10×
P1 logs, json, level equals 1h 146 ms 166 ms 80 ms 2.08×
P2 logs, logfmt, level not equal 1h 44 ms 32 ms 38 ms 0.84×
P3 logs, json, level existence 1h 135 ms 143 ms 82 ms 1.74×
P4 logfmt count by level 1h 36 ms 35 ms 49 ms 0.71×
P5 json count by level 1h 151 ms 122 ms 191 ms 0.64×
P6 json count, level filter 1h 16 ms 16 ms 168 ms 0.10×
P7 json rate by level, level regexp 1h 21 ms 18 ms 191 ms 0.09×
P8 json count by a name that is no stream label 1h 98 ms 95 ms 170 ms 0.56×
P9 instant logfmt by level instant 7 ms 7 ms 10 ms 0.70×
E1 json duration_ms sum by service 1h 96 ms 84 ms 187 ms 0.45×
E2 json duration_ms p95 by service 1h 282 ms 270 ms 203 ms 1.33×
E3 logfmt latency_ms rate, production 1h 526 ms 510 ms 1.32 s 0.39×
E4 logfmt size_bytes max by service 1h 46 ms 45 ms 185 ms 0.24×
E5 json duration_ms sum, instant instant 40 ms 35 ms 28 ms 1.25×
E6 logfmt ttl unit string (Loki 400) 1h 400 400 400 —
E7 json hexadecimal trace_id (Loki 400) 1h 400 400 400 —
E8 json duration_ms sum by service, namespace prod 1h 189 ms 190 ms 632 ms 0.30×
E9 logfmt latency_ms sum by service, namespace prod 1h 415 ms 413 ms 1.13 s 0.37×
U1 json duration_ms sum by service 1h 90 ms 95 ms 266 ms 0.36×
U10 instant sum_over_time unwrap instant 37 ms 41 ms 29 ms 1.41×
U11 instant max_over_time missing label instant 6 ms 5 ms 15 ms 0.33×
U12 json duration_ms over every service 1h 236 ms 247 ms 927 ms 0.27×
U13 logfmt latency_ms over every service 1h 518 ms 499 ms 1.59 s 0.31×
U14 duration() of a unit string 1h 45 ms 45 ms 60 ms 0.75×
U2 json duration_ms max by service 1h 98 ms 92 ms 1.22 s 0.08×
U3 json duration_ms sliding sum 1h 93 ms 83 ms 282 ms 0.29×
U4 logfmt size_bytes sum by service 1h 41 ms 41 ms 59 ms 0.69×
U5 logfmt ttl unit string (no sample) 1h 48 ms 39 ms 54 ms 0.72×
U6 missing label, no parser 1h 19 ms 18 ms 98 ms 0.18×
U7 missing label, ungrouped sum 1h 17 ms 19 ms 106 ms 0.18×
U8 rate of an unwrapped label 1h 86 ms 102 ms 256 ms 0.40×
U9 bytes() conversion 1h 55 ms 54 ms 66 ms 0.82×

↺ Loki cold taken from the first set that ran the same query; Loki's cache answered this one.

Why these shapes
  • internal/proxy/unwrap_conversion_error.go → 59: control/instant json filtered, control/instant json volume, control/json rate by level (no filter, no drop), control/json volume no filters, extracted-pushdown/X1 json filter level_extracted, by level, extracted-pushdown/X2 json group by level_extracted, extracted-pushdown/X3 json rate, level_extracted equality, extracted-pushdown/X4 json bytes, level_extracted regexp …
  • control smoke → 8: control/drilldown service landing, control/instant ungrouped rate, control/json rate by level (no filter, no drop), control/json volume no filters, control/logs plain, control/logs | json, control/stream-label count by app, control/topk rate by app

base ee900031f3 → PR 22eb32c314 · 4 runs (first is cold), warm p50 · ranges 1h · noise ±30% and 100 ms · VictoriaLogs restarts 0→0 · 7.8 min. Same runner, one fresh stack, targets interleaved per request. How to read and reproduce: bench/ab/README.md.

@github-actions

Copy link
Copy Markdown
Contributor

✅ Visual smoke: passed with warnings

Base ee900031f3 vs PR a1331141ef, Grafana through the proxy builds and Loki on one fresh stack; run.
Core set: 5 capture(s) at 1h. Detailed set: 14 entries (explore-A, explore-B, explore-C, explore-F, explore-logs-extracted, explore-extracted-metric, explore-extracted-filter-metric, explore-extracted-group-metric, ...). 19 capture(s), 15m/1h/6h, 24h and 7d stay out of PR runs.
Trimmed to the 1h range for the capture budget: explore-A, explore-B, explore-C, explore-F, explore-logs-extracted, explore-extracted-metric, explore-extracted-filter-metric, explore-extracted-group-metric, explore-logs-plain-level, explore-plain-level-metric, explore-unwrap-sum, explore-unwrap-unit-string, explore-unwrap-missing-label, explore-unwrap-conversion-error.

page range set base = PR (data) vs Loki (PR) pixel diff result
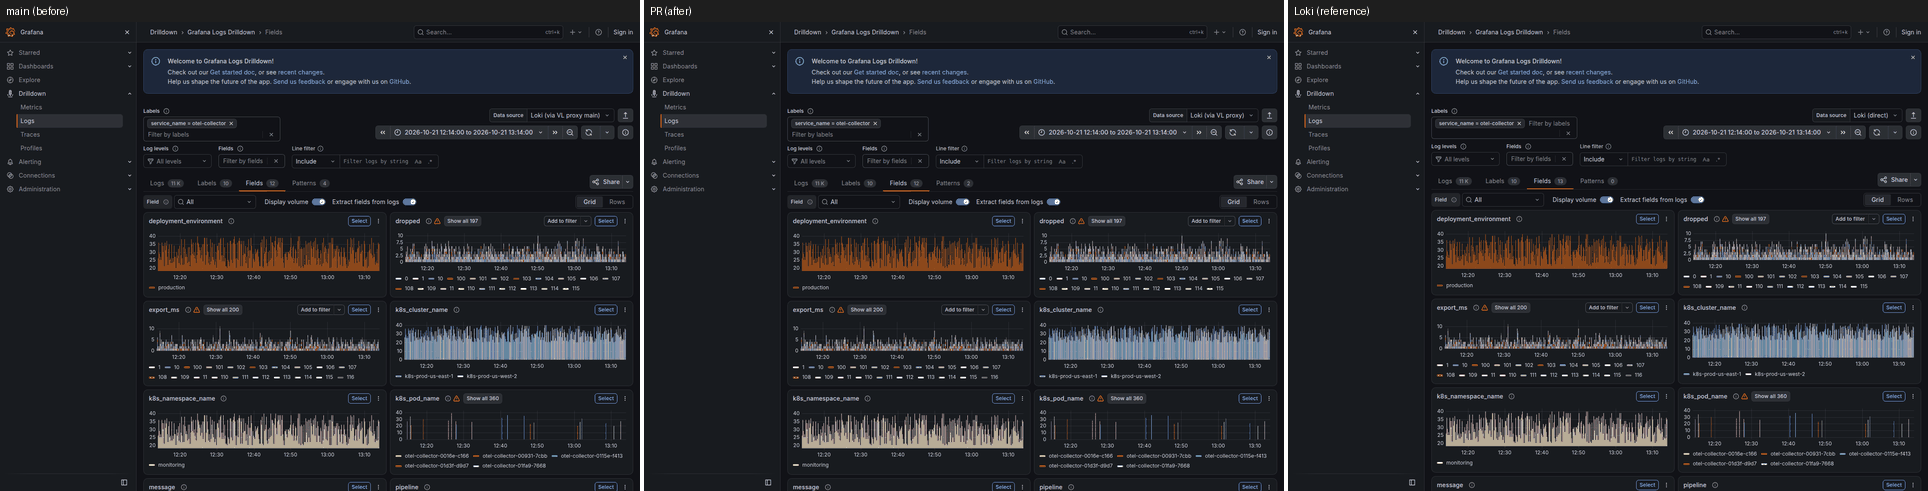
dd-fields 1h core ✅ identical identical (4 explained, 1 history-dependent) 0.12% ⚠️ history-dependent difference, not gated (1): resource /api/datasources/uid/*/res
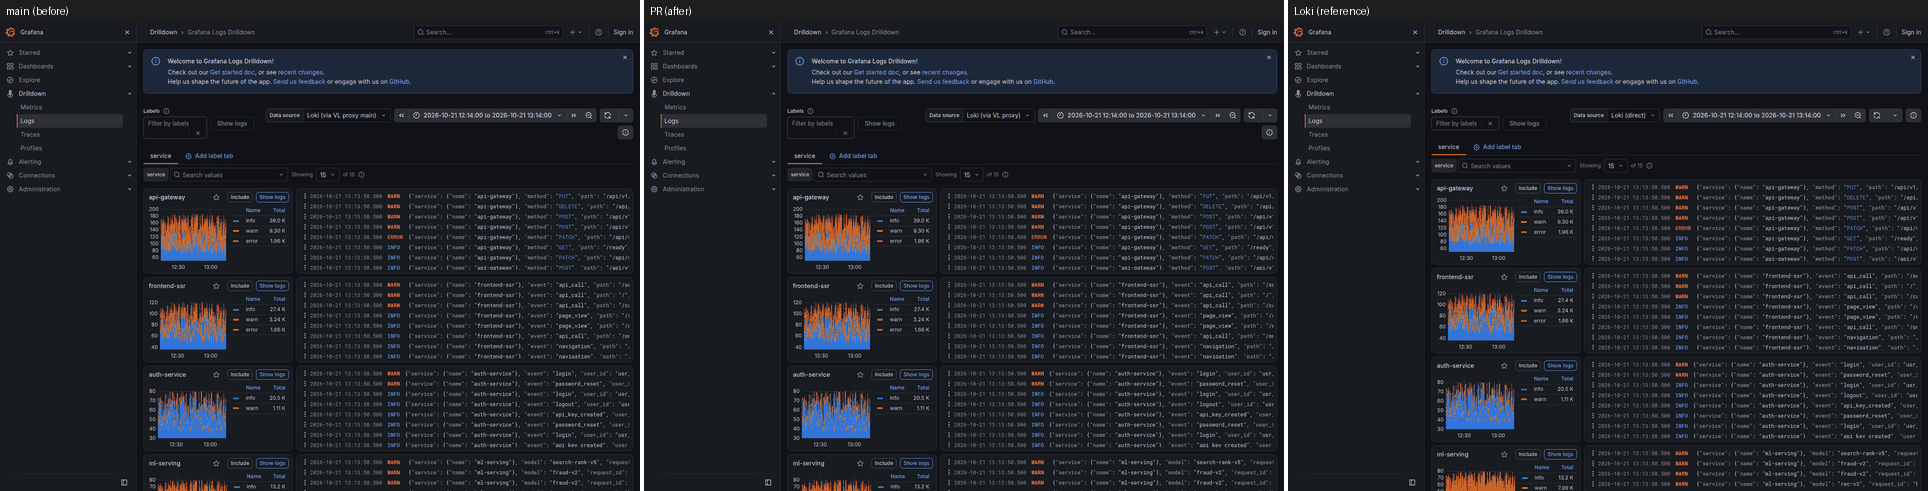
dd-landing 1h core ✅ identical identical (3 explained) 0.14% ✅
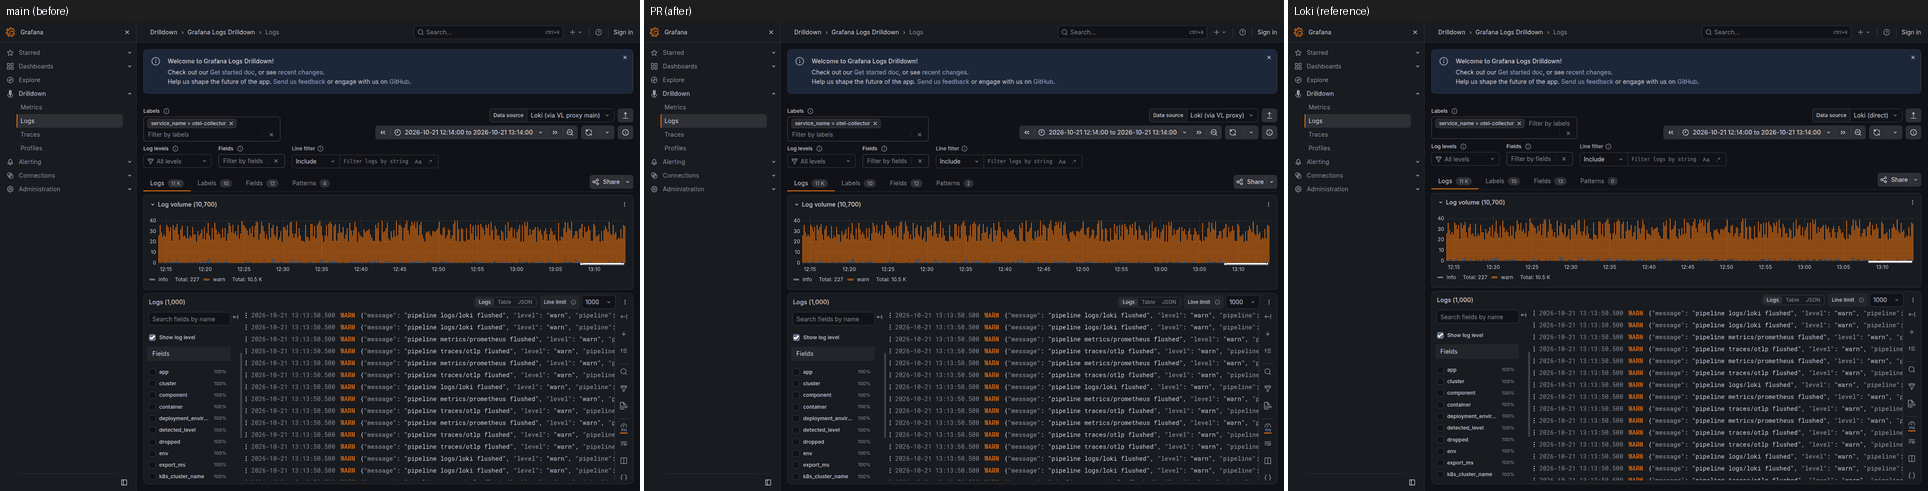
dd-service-logs 1h core ✅ identical identical (3 explained, 1 history-dependent) 0.12% ⚠️ history-dependent difference, not gated (1): resource /api/datasources/uid/*/res
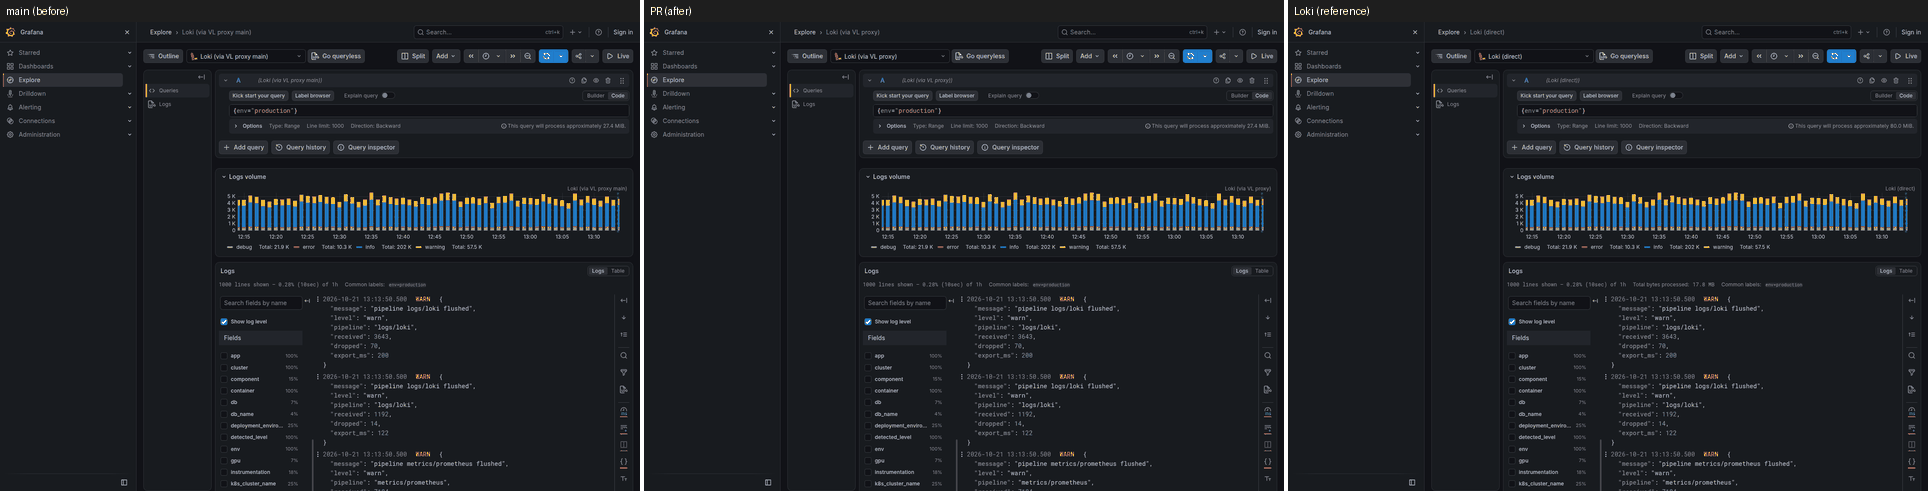
explore-logs-plain 1h core ✅ identical 1 difference(s), 1 on base too 0.07% ✅
explore-metric-plain 1h core ✅ identical 1 difference(s), 1 on base too 0.04% ✅
explore-A 1h detailed ✅ identical 1 difference(s), 1 on base too 0.04% ✅
explore-B 1h detailed ✅ identical 1 difference(s), 1 on base too 0.04% ✅
explore-C 1h detailed ✅ identical 1 difference(s), 1 on base too 0.04% ✅
explore-F 1h detailed ✅ identical 1 difference(s), 1 on base too 0.04% ✅
explore-extracted-filter-metric 1h detailed ✅ identical 1 difference(s), 1 on base too 0.04% ✅
explore-extracted-group-metric 1h detailed ✅ identical 1 difference(s), 1 on base too 0.04% ✅
explore-extracted-metric 1h detailed ✅ identical 1 difference(s), 1 on base too 0.04% ✅
explore-logs-extracted 1h detailed ✅ identical 1 difference(s), 1 on base too 0.07% ✅
explore-logs-plain-level 1h detailed ✅ identical 1 difference(s), 1 on base too; 1 explained 0.07% ✅
explore-plain-level-metric 1h detailed ✅ identical 1 difference(s), 1 on base too 0.04% ✅
explore-unwrap-conversion-error 1h detailed ✅ identical 1 difference(s), 1 on base too 0.04% ✅
explore-unwrap-missing-label 1h detailed ✅ identical 1 difference(s), 1 on base too 0.04% ✅
explore-unwrap-sum 1h detailed ✅ identical 2 difference(s), 2 on base too 0.04% ✅
explore-unwrap-unit-string 1h detailed ✅ identical 1 difference(s), 1 on base too 0.04% ✅

Gate: a base-vs-PR data difference passes when the PR is closer to Loki, and fails when the PR diverges from Loki or Loki cannot decide it (at a range Loki does not hold, a difference passes when the same page proved it closer to Loki at a shorter range; otherwise label the pull request visual-change-expected to accept an intended change). Also failing: a panel empty on the PR but not on the base, an error banner, panel error, error answer or new "No data" panel on the PR, a PR side that never settled, a difference that did not reproduce on the recapture. Pixel differences only warn.

dd-fields-1h: history-dependent difference, not gated (1): resource /api/datasources/uid/*/resources/patterns?end=2026-10-21T13%3A14%3
  • history-dependent difference, not gated (1): resource /api/datasources/uid/*/resources/patterns?end=2026-10-21T13%3A14%3A00.000Z&query=%7Bservic: body: content differs (rows 4 vs 2)
  • vs Loki, explained: query ('sum by (service_name_extracted) (count_over_time({service_name="otel-collector"} | servi: request only on one side (right) -- explained: Loki's _extracted suffix for a key named like a stream label, where the build does not return it (detected_fields: open, semantics/detected-fields-extracted-suffix; service/service.name: owner decision)
  • vs Loki, explained: resource /api/datasources/uid/*/resources/detected_fields?end=2026-10-21T13%3A14%3A00.000Z&query=%7: body: content differs (rows 13 vs 15) -- explained: Loki's _extracted suffix for a key named like a stream label, where the build does not return it (detected_fields: open, semantics/detected-fields-extracted-suffix; service/service.name: owner decision); the proxy also returns data, status; Loki lists fields in no fixed order
  • vs Loki, explained: resource /api/datasources/uid/*/resources/detected_labels?end=2026-10-21T13%3A14%3A00.000Z&query=%7: body: content differs (rows 9 vs 9) -- explained: sampled cardinality: Loki counts every stream its ingesters hold, not the requested window (pkg/ingester/instance.go LabelsWithValues), the proxy the window's last 5 minutes (metadataMaxFieldNamesWindow); the label names match; the proxy also returns data, limit, status; Loki lists labels in no fixed order
  • vs Loki, explained: resource /api/datasources/uid/*/resources/drilldown-limits: body: content differs (rows 0 vs 0) -- explained: configuration probe: each backend publishes its own limits, version and settings (the proxy's pattern persistence)

dd-fields-1h

dd-service-logs-1h: history-dependent difference, not gated (1): resource /api/datasources/uid/*/resources/patterns?end=2026-10-21T13%3A14%3
  • history-dependent difference, not gated (1): resource /api/datasources/uid/*/resources/patterns?end=2026-10-21T13%3A14%3A00.000Z&query=%7Bservic: body: content differs (rows 4 vs 2)
  • vs Loki, explained: resource /api/datasources/uid/*/resources/detected_fields?end=2026-10-21T13%3A14%3A00.000Z&query=%7: body: content differs (rows 13 vs 15) -- explained: Loki's _extracted suffix for a key named like a stream label, where the build does not return it (detected_fields: open, semantics/detected-fields-extracted-suffix; service/service.name: owner decision); the proxy also returns data, status; Loki lists fields in no fixed order
  • vs Loki, explained: resource /api/datasources/uid/*/resources/detected_labels?end=2026-10-21T13%3A14%3A00.000Z&query=%7: body: content differs (rows 9 vs 9) -- explained: sampled cardinality: Loki counts every stream its ingesters hold, not the requested window (pkg/ingester/instance.go LabelsWithValues), the proxy the window's last 5 minutes (metadataMaxFieldNamesWindow); the label names match; the proxy also returns data, limit, status; Loki lists labels in no fixed order
  • vs Loki, explained: resource /api/datasources/uid/*/resources/drilldown-limits: body: content differs (rows 0 vs 0) -- explained: configuration probe: each backend publishes its own limits, version and settings (the proxy's pattern persistence)

dd-service-logs-1h

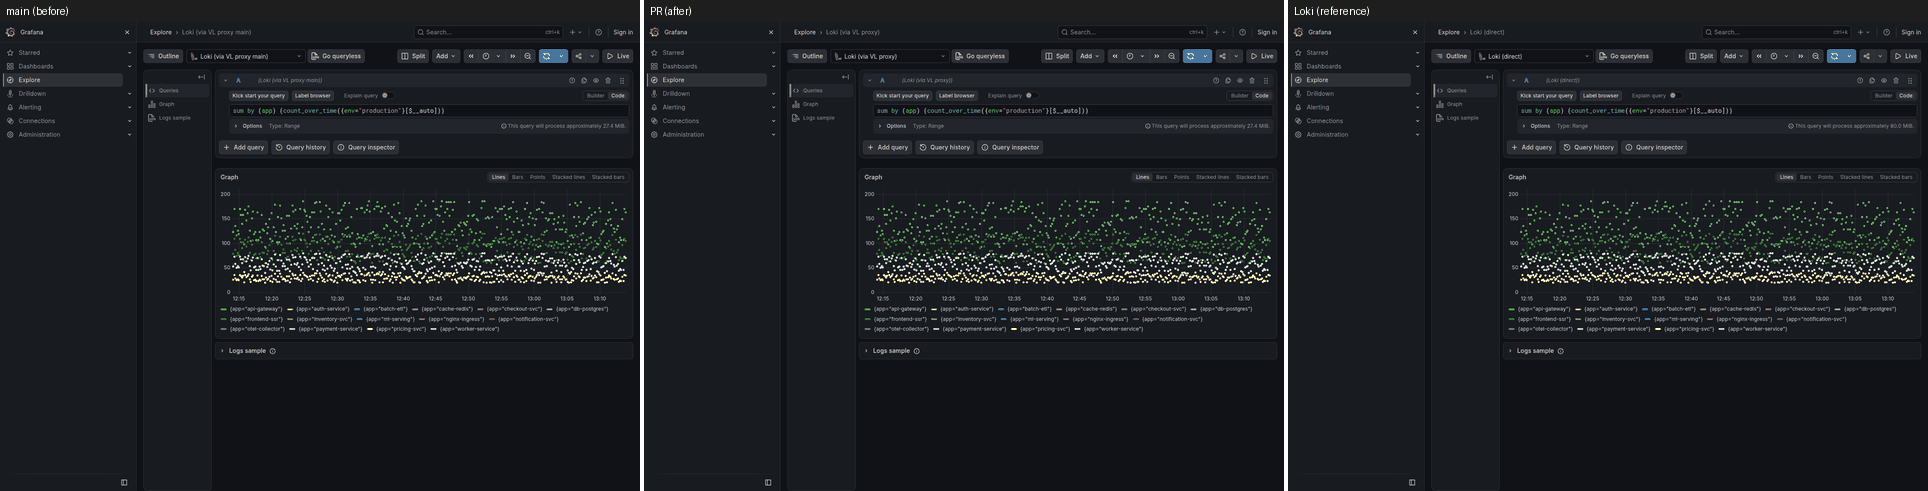
Core set montages (3): base | PR | Loki

dd-landing-1h

dd-landing-1h

explore-logs-plain-1h

explore-logs-plain-1h

explore-metric-plain-1h

explore-metric-plain-1h

All montages of this run: pr-visuals/pr-788.

@github-actions

Copy link
Copy Markdown
Contributor

PR Quality Report

Compared against base branch main.

Coverage and tests

Signal Base PR Delta
Test count 11763 11763 0
Coverage 88.3% 88.4% +0.1% (improved)

Compatibility

Track Base PR Delta
Loki API 100.0% 11/11 (100.0%) 0.0% (stable)
Logs Drilldown 100.0% 17/17 (100.0%) 0.0% (stable)
VictoriaLogs 100.0% 11/11 (100.0%) 0.0% (stable)

Performance smoke

Lower CPU cost (ns/op) is better. Lower benchmark memory cost (B/op, allocs/op) is better. Higher throughput is better. Lower load-test memory growth is better. Benchmark rows are medians from repeated samples.

Signal Base PR Delta
QueryRange cache-hit CPU cost 3487.0 ns/op 3464.0 ns/op -0.7% (stable)
QueryRange cache-hit memory 1240.0 B/op 1240.0 B/op 0.0% (stable)
QueryRange cache-hit allocations 27.0 allocs/op 27.0 allocs/op 0.0% (stable)
QueryRange cache-bypass CPU cost 4140.0 ns/op 4170.0 ns/op +0.7% (stable)
QueryRange cache-bypass memory 1303.0 B/op 1303.0 B/op 0.0% (stable)
QueryRange cache-bypass allocations 27.0 allocs/op 27.0 allocs/op 0.0% (stable)
Labels cache-hit CPU cost 898.1 ns/op 889.6 ns/op -0.9% (stable)
Labels cache-hit memory 48.0 B/op 48.0 B/op 0.0% (stable)
Labels cache-hit allocations 3.0 allocs/op 3.0 allocs/op 0.0% (stable)
Labels cache-bypass CPU cost 1498.0 ns/op 1519.0 ns/op +1.4% (stable)
Labels cache-bypass memory 400.0 B/op 400.0 B/op 0.0% (stable)
Labels cache-bypass allocations 14.0 allocs/op 14.0 allocs/op 0.0% (stable)

State

  • Coverage, compatibility, and sampled performance are reported here from the same PR workflow.
  • This is a delta report, not a release gate by itself. Required checks still decide merge safety.
  • Performance is a smoke comparison, not a full benchmark lab run.
  • Delta states use the same noise guards as the quality gate (percent + absolute + low-baseline checks), so report labels match merge-gate behavior.

Sign up for free to join this conversation on GitHub. Already have an account? Sign in to comment

Labels

bugfix Bug fix scope/docs Documentation scope/proxy Proxy core size/S Small change

Projects

None yet

Development

Successfully merging this pull request may close these issues.

1 participant