Skip to content

perf: answer near-now label lists within a budget, at most 10s behind - #877

Merged
szibis merged 2 commits into
mainfrom
perf/labels-inventory-first
Oct 27, 2026
Merged

szibis merged 2 commits into
mainfrom
perf/labels-inventory-first

Conversation

@szibis

@szibis szibis commented Oct 27, 2026

Copy link
Copy Markdown
Collaborator

Summary

A near-now /labels or /label/{name}/values no longer waits for a busy VictoriaLogs. The request waits at most -metadata-edge-refresh-budget (default 100ms) for its edge refresh:

  • If the refresh finishes in time, the answer is exact.
  • If not, the request gets the last answer this replica read for the same tenant, auth scope and window, at most -metadata-max-staleness (default 10s) old. The refresh completes in the background, and the next request lists what it found.
  • Past the bound, the request waits for VictoriaLogs as before.

This is a documented, owner-approved difference from Loki, registry quality/metadata-bounded-staleness (owner-kept). -metadata-max-staleness=0 restores exact answers.

Branch base: origin/main (fc506876, v2.36.0 metadata; rebased after #746 merged, with the CHANGELOG rebuilt from main so the entries stay under [Unreleased] and the generated conformance reports regenerated), two commits:

  • f76420cc: bounded-stale answers.
  • a6d11efe: the label warm-up records its reads, so the first request for a warmed preset after a pass is also answered within the budget.

The change needs nothing from the default-lookback PR. The branches can land in either order; whichever lands second is rebased.

A trial merge of both heads conflicts in:

  • CHANGELOG.md, values.yaml, cmd/proxy/main.go, the Config comment block in proxy.go, docs/configuration.md, KNOWN_ISSUES.md;
  • the generated docs and conformance reports (regenerate them);
  • one hunk in warmLabelWindows. There, keep M1's fetchCtx := context.WithTimeout(withBackgroundInventory(w.req.Context()), ...) and add this PR's two lines after it: labelCacheBypassKey and readStarted.

With that resolution the merged tree builds. A throwaway test on it (not committed) shows the intended combination works: after a warm pass as tenant 1 (M1's -labels-cache-warm-tenants), the first /labels from tenant 1 for 1h, 6h and 24h, with VictoriaLogs holding the edge, is answered stale in 50-53 ms against a 50 ms budget.

What was wrong

Load evidence: 32 heavy clients running 6 h range-metric shapes, plus a /labels probe every 1-2 s.

idle under load
/labels p95 5-40 ms 50-450 ms
stream_field_names latency inside VictoriaLogs 14-67 ms p50 0.35-0.6 s p95, up to 2.6 s
VictoriaLogs CPU (8 cores) 360-470 % avg, up to 860 %

The numbers are the same on main and with the metadata lane reserving VictoriaLogs select slots. The proxy never queued a metadata call (backend_select_lane_queued{lane="metadata"} stayed 0); the time was spent inside VictoriaLogs.

The steady-state cost is the synchronous near-now edge read:

  • A request ending within -max-metadata-cache-freshness (24h) of now counts as near-now (nearNowWindow).
  • Its cached answer counts as stale once older than -recent-tail-refresh-max-staleness, which is 2 s (shouldBypassStaleEntry).
  • A stale answer is refetched through the inventory before the request is answered. Settled buckets come from cache, but the unaligned left edge, the last minute and the empty-run counts are VictoriaLogs calls (metadataCacheLookup, syncFetchStrings).
  • A probe every 1-2 s therefore always paid at least one VictoriaLogs round trip, queued behind heavy selects.

Loki does not lag:

  • It lists labels from ingesters for the recent interval plus its index (pkg/querier/querier.go:307-342).
  • It never caches a metadata answer whose end is within max_metadata_cache_freshness (pkg/querier/queryrange/series_cache.go:111-125, used by the labels cache).

Design

  • Decision point. The existing near-now check decides: only a request that today would refetch synchronously (freshFetch) is considered. A request ending earlier than the freshness window is answered from its cached answer, as before. It is settled, never stale, and never refreshed by this path.
  • One answer closure per handler. handleLabels and handleLabelValues now build their answer in one closure. It lists, post-processes, stores the cache entry and records the read time. The synchronous path and the detached refresh both run it, so the stored answer is identical either way.
    • The service_name values path folds into the label-values closure and keeps its own browse-window rule (labelValuesBrowseWindow).
  • Detached refresh (startMetadataEdgeRefresh):
    • One singleflight flight per cache key.
    • The request is cloned with context.WithoutCancel, so tenant, routing and auth fingerprint are kept. It runs under the background timeout (labelBackgroundTimeout, at most 10 s), from a proxy-lifetime base context that Shutdown cancels, tracked by a WaitGroup that Shutdown waits for.
    • It uses foreground admission, not the skip-if-busy background-inventory mode, so a request that joins it never inherits a refusal it would not get on its own.
    • Its listing fetch goes through the same sync:+key singleflight as synchronous waiters, so a request past the bound joins the running refresh instead of starting a second VictoriaLogs pass.
  • Staleness clock (recordMetadataEdgeRead):
    • The clock starts when the VictoriaLogs read behind the stored answer started. syncFetchStringsAt returns the start time of the shared fetch's leader.
    • The record is per cache key (tenant, auth scope, endpoint, window). It is written after the answer is stored, and the stale path reads the cache after reading the record, so the answer it serves is at least as fresh as the record.
    • An entry whose age is unknown is never served stale. That covers a copy read from disk or from a peer: it is not the answer this replica recorded.
    • Residual: after an L1 eviction, a disk or peer copy pulled back into L1 gets a fresh local age. A disk copy is written together with L1, so it is the same answer. A peer copy could be older. This needs an eviction within the bound and is not handled.
    • An empty answer is never served stale. It is a negative entry (data may not have been searchable yet), the same rule as stale-on-error.
    • The map holds the keys read within the bound; it is pruned by age whenever it doubles.
  • Budget (serveMetadataEdge):
    • The request waits up to the budget. A refresh result inside it is written as the exact answer, and a refresh error inside it goes to the existing error path (stale-on-error or the error).
    • When the budget expires, the stale answer is served only if the bound still holds at that moment. Otherwise the request keeps waiting for the refresh.
  • No layer keeps a stale answer. It carries X-Proxy-Stale-Response: true (markStaleResponse, which also sets Cache-Control: no-store). The compatibility-edge cache (compatCacheCaptureAllowed) and the multi-tenant merge cache already skip responses with that header.
  • Warm-up record (second commit). warmLabelWindows records when each window's read started, after the answer is stored. An empty listing stores nothing and records nothing. The warm read skips the short-lived exact-window field-name cache (labelCacheBypassKey), as a background refresh does, so the recorded start is the real age of the data.
  • Joined refreshes. An exact answer taken from a refresh another request started can carry data whose read began up to the background timeout earlier: 10 s at most, the same as the default bound. This is what any request that joins an in-flight listing gets today.
  • Shared fetch retry. A follower of a shared listing fetch whose leader ran out of its own deadline (the detached refresh's timeout) now retries, as it already did when the leader was cancelled. A leader whose own call timed out does not retry.
  • /series: not included. It has no response cache and no inventory: handleSeries calls /select/logsql/streams directly through the coalescer (internal/proxy/label_handlers.go:404-440), and streams is not in metadataInventoryPaths. Giving it the same treatment means adding a response cache and inventory first (follow-up).

Flags and defaults

flag default why
-metadata-max-staleness 10s VictoriaLogs makes ingested rows searchable within about a second (rows-buffer flush timer, lib/logstorage/datadb.go:776 in v1.49.0, :780 in v1.53.0). Grafana's shortest dashboard refresh is 5 s (min_refresh_interval, conf/defaults.ini:608). So a new label or value shows at most two refreshes late. It is above -recent-tail-refresh-max-staleness (2 s); a lower value adds nothing. 0 disables the feature.
-metadata-edge-refresh-budget 100ms An idle VictoriaLogs answers /labels at 5-40 ms p95, so answers stay exact when it is not busy. Under load the edge listing took 0.35-0.6 s at p95 and up to 2.6 s; the budget turns those into answers bounded by the staleness flag. 0 serves the last answer at once whenever one is within the bound.

Both flags are declared in the config registry (internal/config/limits.go), with bounds, metric, sizing and Loki parity ("none"). Both have Helm extraArgs values and rows in docs/configuration.md, and docs/KNOWN_ISSUES.md gains a row. The generated configuration reference and limits registry were regenerated. The flags sit in the cache category.

The library Config zero value keeps the feature off. Only the binary's flag defaults turn it on, the same pattern as MetadataCacheFreshness.

Background refreshes are bounded:

  • one flight per cache key;
  • each ends within the background timeout;
  • Shutdown cancels them;
  • their VictoriaLogs calls go through the existing backend budget (-max-concurrent).

A refresh starts only for a key this replica answered within the bound. There is no separate cap on how many keys refresh at once; whether one is wanted is an open question below.

Metrics

All are on the existing internal-operation counter and histogram. Their buckets reach 10 s, which covers the default bound.

series meaning
loki_vl_proxy_internal_operation_total{operation="metadata_edge_answer",outcome="exact"|"stale"|"waited"} near-now answers refreshed within the budget, served from the last answer, or that waited for VictoriaLogs (no answer within the bound); the duration is the request's wait
loki_vl_proxy_internal_operation_duration_seconds{operation="metadata_edge_staleness",outcome="labels"|"label_values"} age of each stale answer
loki_vl_proxy_internal_operation_duration_seconds{operation="metadata_edge_refresh",outcome="ok"|"error"} background refresh duration

Tests (internal/proxy/metadata_edge_refresh_test.go)

The tests use a fake VictoriaLogs whose near-now listings can be held at a gate. "Did not wait" is proven by the gate still holding the refresh when the answer arrives, not by wall-clock time. Every request that must not wait fails the test after 5 s instead of hanging.

test what
TestMetadataEdge_StaleWithinBudgetThenFreshOnTheNextRequest /labels and /label/app/values, with the inventory on: the second answer is served within the 50 ms budget while the edge refresh is held at the gate. It equals the first answer and is marked stale. After the refresh completes, the next request lists the label or value that appeared meanwhile.
TestMetadataEdge_PastTheBoundTheRequestWaits the request does not answer while the gate is closed, then answers exactly with the new label, in three cases: the last read is older than the bound, -metadata-max-staleness=0, or the last answer was empty
TestMetadataEdge_ConcurrentRequestsShareOneRefresh 20 concurrent requests for one key: one VictoriaLogs listing for that window, all 20 answered stale within the budget
TestCompat_LabelsIncludeStreamWrittenAfterCaching (e2e, group core, changed) It now asks again 11 s after the second stream, past the 10 s bound, instead of after 3 s. Within the bound, a slow refresh may answer from the answers read before that stream, which is the documented deviation. Its Loki comparison is unchanged.
TestMetadataEdge_StaleAnswersStayPerTenant tenant 1 is served its own stale answer; tenant 2, never answered on this replica, waits for VictoriaLogs and gets its own exact answer, never tenant 1's
TestMetadataEdge_SettledWindowsAreNeverStale a window ending 25 h ago is served from cache, not marked stale, with no VictoriaLogs call
TestMetadataEdge_FirstRequestAfterWarmUpAnswersWithinBudget (second commit) after the 1h preset is warmed, the first Grafana-shaped /labels, with VictoriaLogs holding its edge, is answered within the 50 ms budget (plus a 2 s allowance) from the warm answer, marked stale, without the label written since, and it starts the refresh. Removing the record line makes it fail.
TestMetadataEdge_ShutdownStopsBackgroundRefreshes Shutdown cancels a refresh held in VictoriaLogs (the fake sees its request context end), every goroutine returns to baseline, and no refresh starts after Shutdown
  • A mutation check that turns stale serving off makes four of the six tests fail within seconds, not by timeout.
  • -race:
    • Two of the first eight combined runs (-run 'TestMetadataEdge|TestLabel.*Fresh|Freshness|TestHandleLabel|TestLabelValues|TestProxyLifecycle', -count=3) failed. The failures were in the stale-within-budget and shared-refresh tests, which checked that the background refresh had reached the fake VictoriaLogs right after the stale answer came back. Under -race on a loaded host the refresh can reach it a little later.
    • The tests now wait (up to 5 s) for the refresh to reach the gate. They also wait for the refresh to record its read before the following request, and count only listings of the request's own window, not a background stream-label-names listing.
    • After these changes, 5 of 5 combined -race runs (-count=3) and a -count=20 run without -race pass. These were the likely causes; the original failure was not reproduced in isolation.

Gates:

  • Unit, capped (GOMEMLIMIT=2GiB GOMAXPROCS=4 go test -short -count=1 -p 1).
  • Full capped run (./cmd/... ./internal/...): every package ok, before the rebase, on 787813d0 (peak RSS 1.81 GiB, 1,938,522,112 B) and on the final head 0b3a2244 (peak RSS 1.78 GiB, 1,911,324,672 B); origin/main 1.87 GiB (2,009,694,208 B) on the same host.
  • go vet ./... and go vet -tags e2e ./test/e2e-compat/: ok.
  • golangci-lint: 0 issues.
  • check_conformance.py: conformance gate ok.
  • check_changelog_pr.py --base origin/main: ok.
  • go run ./cmd/configdoc -check: ok.

Registry

id: quality/metadata-bounded-staleness
title: Near-now label answers may lag VictoriaLogs by at most -metadata-max-staleness (owner-kept deviation)
proves:
  - data-probing-and-freshness
  - loki_api_v1_labels
  - loki_api_v1_label_name_values
consumer: explore
request:
  method: GET
  path: /loki/api/v1/labels
  params:
    start: 'now-1h'
    end: 'now'
  headers:
    X-Scope-OrgID: "0"
compare:
  mode: observed
  fields: [data]
  expect: |
    Loki's labels of the window, at most -metadata-max-staleness behind
    VictoriaLogs; a label written since appears on the first request after
    the background refresh.
gap:
  status: owner-kept
  impact: explore-visible
  effort: S
  area: 'internal/proxy/metadata_edge_refresh.go serveMetadataEdge; -metadata-max-staleness, -metadata-edge-refresh-budget'
  loki: 'pkg/querier/querier.go:307-342 Label reads ingesters; pkg/querier/queryrange/series_cache.go:111-125 shouldCacheMetadataReq'
  proxy: 'last answer within the bound when the edge refresh misses the budget'
  planned_test: 'TestMetadataEdge_* (internal/proxy)'
  clusters: []

The why: text is in the file. It cites the Loki references above, the load numbers, the mechanism, and the owner's approval on 2026-10-27.

Proof

All runs on the local Colima VM (8 CPU, 14 GB) shared with other stacks and other work on the host; the host load average is recorded per target and was high (11 to 26 at the start of a target), so absolute latencies are inflated and only the relative numbers matter. VictoriaLogs and Loki restart counts were 0 before and 0 after every run.

After the rebase (checked on 3ee88f11, repeated for the changelog and conformance gates on fc506876): go build, go vet ./..., go vet -tags e2e ./test/e2e-compat/, go run ./cmd/configdoc -check, gofmt -l, check_conformance.py and check_changelog_pr.py --base origin/main all ok; go test -run 'TestMetadataEdge|TestLabel.*Fresh|Freshness|TestHandleLabel|TestLabelValues|TestNestedVectorAggregation' ok.

e2e against Loki (fresh isolated copy of the e2e stack per run, CI group patterns, head 0b3a2244 before the rebase)

Counts are --- PASS / --- FAIL / --- SKIP lines, subtests included.

group VictoriaLogs v1.49.0 VictoriaLogs v1.53.0
core 2905 / 0 / 87 2905 / 0 / 87
drilldown 80 / 0 / 0 80 / 0 / 0

The changed TestCompat_LabelsIncludeStreamWrittenAfterCaching passes on both (11.9 s, it asks again past the 10 s bound). The rebase onto 3ee88f11 adds only #746's nested-aggregation code to this branch; the e2e groups were not re-run on the rebased head.

Metadata-probe load (mpl_abba.py: main A, PR, Loki, PR, main B)

One fresh stack (Loki and VictoriaLogs v1.52.0 compose services, 7 h of generator data), 32 heavy clients looping over the range-metric shapes at 6 h for 180 s per target, a probe of /labels (no window, 1 h, 6 h), /label/app/values and /series rotating once a second, then 30 s idle. main is 3ee88f11; both builds run their own defaults for -metadata-default-lookback (12h). Cells are p95 / max / first probe in ms; the first probe is the first request after the proxy started.

route main1 pr1 loki pr2 main2 idle p95 (main1, pr1, pr2, main2)
labels 279.5 / 484.3 / 2272.4 103.6 / 106.7 / 1833.8 6242.5 / 6242.5 / 8.2 142.5 / 187.1 / 3247.1 210.5 / 598.6 / 1818.0 9.5, 6.4, 5.7, 4.1
labels_1h 181.2 / 246.1 / 160.4 82.2 / 102.3 / 186.6 4387.9 / 4387.9 / 3927.0 107.0 / 119.5 / 142.5 171.6 / 251.5 / 12.1 51.5, 4.3, 6.7, 4.2
labels_6h 162.4 / 167.2 / 261.1 102.0 / 102.1 / 288.9 11659.5 / 11659.5 / 11659.5 116.6 / 272.7 / 272.7 183.5 / 373.3 / 351.5 32.0, 7.9, 8.5, 6.4
label_values 365.4 / 371.0 / 371.0 116.1 / 1734.6 / 1734.6 4856.0 / 4856.0 / 3547.6 236.0 / 549.5 / 549.5 350.4 / 851.3 / 851.3 30.2, 7.4, 11.1, 17.8
series 397.1 / 404.2 / 218.9 183.3 / 348.9 / 157.6 4662.4 / 4662.4 / 1535.5 384.8 / 484.0 / 69.2 148.0 / 167.4 / 121.5 32.3, 12.8, 21.6, 12.7
target requests per s 200 400 429 502 other ok p50 ms ok p95 ms proxy peak RSS MB VL CPU avg / max % load avg at start
main1 646 3.59 604 30 5 7 0 7140 22594 2822.4 388.0 / 926.15 12.76 19.12 23.36
pr1 866 4.81 810 42 5 9 0 5669 19869 3271.9 380.0 / 796.59 18.85 20.98 23.28
loki 449 2.49 431 18 0 0 0 9610 33750 None 1.0 / 8.95 13.60 19.49 22.26
pr2 663 3.68 619 30 6 8 0 7321 24453 2954.2 394.0 / 947.95 18.87 21.28 22.48
main2 904 5.02 843 47 5 9 0 5398 19826 3298.9 394.0 / 835.0 14.86 20.16 21.86

metadata_edge_answer (the counter of this PR) at the end of each PR target's load phase: PR A 120 exact, 12 stale, 4 waited; PR B 104 exact, 21 stale, 7 waited. metadata_edge_staleness: every stale answer was between 5 and 10 s old (PR A: 8 labels, 4 label values, mean 6.4 s and 5.2 s; PR B: 16 and 5, mean 5.8 s and 5.5 s; none above the 10 s bound). metadata_edge_refresh: 132 and 125 ok, 0 errors.

Reading it:

  • /labels and label values under load: PR p95 82 to 236 ms against main's 162 to 365 ms; the PR's p95 sits at the 100 ms budget plus scheduling on this host. Max on the PR is 102 to 272 ms on the labels routes. One label-values probe in PR A took 1.73 s: its first request after start, with no answer yet to serve stale.
  • /series is not covered by this change (PR 183 and 385 ms against main 397 and 148 ms).
  • The first probe after a fresh start is unchanged (1.8 to 3.2 s on both builds for /labels with no window): no answer exists yet to serve.
  • Heavy-query throughput is unchanged: main 646 and 904 requests, PR 866 and 663 in 180 s (1550 against 1529). Proxy peak RSS 2.8 to 3.3 GB for both builds.
  • Loki under the same load: 4.4 to 11.7 s p95 on these routes.
  • The harness's absolute acceptance (p95 within idle p95 + 50 ms, max 300 ms) is not met by either build on this host; the PR is closer on every labels route.

Combined with the default-lookback PR (scratch merge, not committed)

A throwaway worktree merging the default-lookback head and this head (both on 3ee88f11; the merge was rebuilt on the final heads and still builds and vets), with the warmLabelWindows hunk resolved as described above, built and run as the PR target with -labels-cache-warm-tenants=0:

route main1 pr1 loki pr2 main2 idle p95 (main1, pr1, pr2, main2)
labels 152.2 / 346.7 / 2546.0 102.4 / 103.5 / 8.3 5132.7 / 5132.7 / 117.6 103.1 / 111.2 / 7.3 85.0 / 133.9 / 3254.7 12.8, 8.8, 10.2, 33.6
labels_1h 148.4 / 222.4 / 231.3 101.8 / 103.5 / 1.0 8480.5 / 8480.5 / 6663.4 107.5 / 127.9 / 3.6 250.3 / 288.1 / 146.7 16.3, 10.7, 18.7, 47.2
labels_6h 163.1 / 419.3 / 419.3 103.9 / 105.8 / 102.1 13171.0 / 13171.0 / 13171.0 102.2 / 103.0 / 107.0 230.2 / 265.3 / 230.2 17.4, 10.1, 16.0, 75.4
label_values 246.8 / 345.8 / 246.8 102.8 / 102.9 / 335.4 6375.8 / 6375.8 / 6375.8 111.0 / 122.2 / 1083.6 548.7 / 580.0 / 468.9 16.0, 12.8, 18.3, 104.0
series 257.3 / 294.0 / 294.0 139.0 / 247.8 / 192.6 4967.9 / 4967.9 / 2471.0 329.2 / 387.7 / 244.6 312.1 / 367.9 / 312.1 23.8, 21.1, 34.3, 58.5
target requests per s 200 400 429 502 other ok p50 ms ok p95 ms proxy peak RSS MB VL CPU avg / max % load avg at start
main1 745 4.14 699 32 6 8 0 5503 21467 3390.1 403.0 / 805.95 11.08 15.30 19.21
pr1 846 4.7 791 41 5 9 0 5170 21679 3895.5 394.0 / 802.47 13.57 16.83 19.15
loki 429 2.38 410 19 0 0 0 8889 36831 None 1.0 / 2.42 13.07 16.35 18.53
pr2 856 4.76 801 41 5 9 0 5267 20706 3317.0 420.0 / 821.99 11.11 15.19 17.62
main2 774 4.3 730 33 3 8 0 6133 22048 3193.0 398.0 / 807.89 12.79 16.03 17.56

metadata_edge_answer: PR A 120 exact, 17 stale, 2 waited; PR B 119 exact, 13 stale, 5 waited; every stale answer at most 10 s old (one under 5 s).

With both changes the label routes stay at the budget under load: p95 102 to 111 ms and max 103 to 128 ms on /labels (no window, 1 h, 6 h) and label values; the first /labels after a fresh start is 7 to 8 ms (warm-up as tenant 0 plus its read record) where main takes 2.5 and 3.3 s, and the first 6 h /labels 102 and 107 ms. The first label-values probe is not warmed (335 and 1084 ms, main 247 and 469 ms), and /series is not covered (p95 139 and 329 ms, main 257 and 312 ms). Heavy throughput 846 and 856 requests against main's 745 and 774.

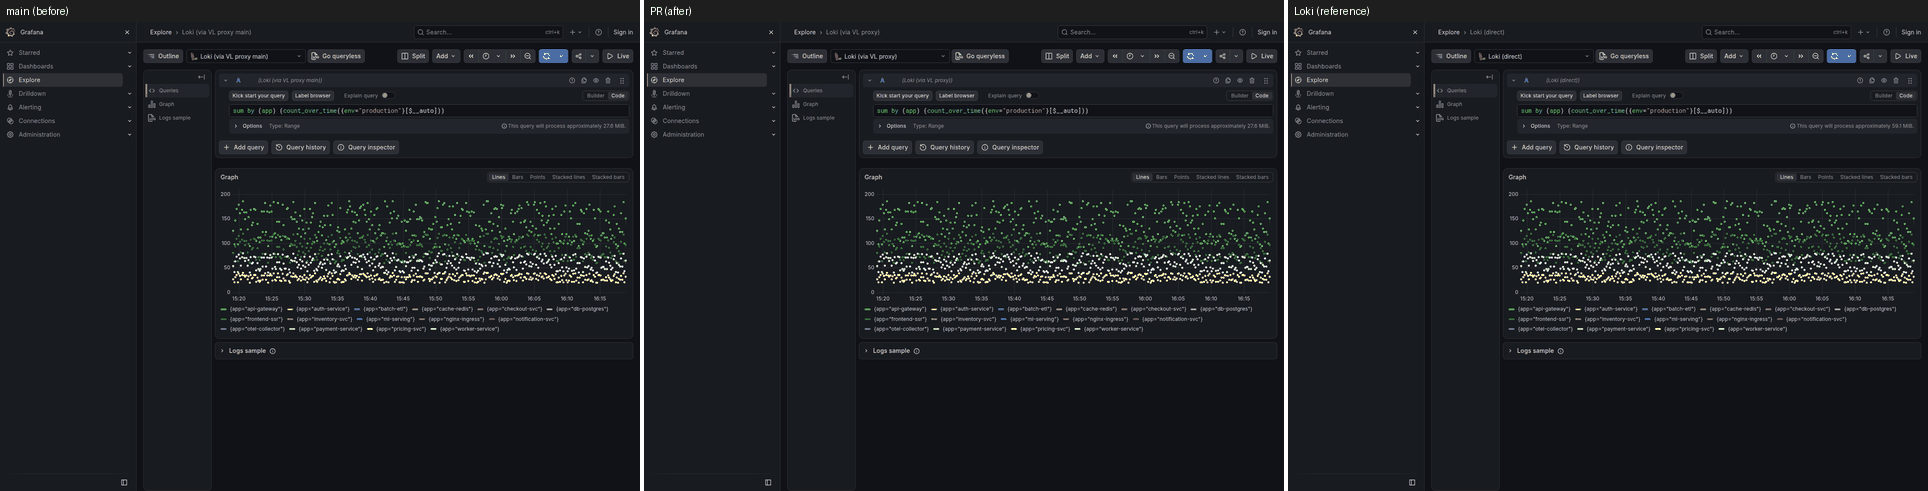
Visual (label browser and Drilldown labels; main, PR and Loki as three Grafana datasources)

bench/visual/ci_run.py --base origin/main with the label-endpoint page list (Explore label browser and log context, Drilldown labels and a label's values at 15 m, 1 h and 6 h, plus the core pages at 1 h), one isolated stack (VictoriaLogs 7 h, Loki 1.5 h of the same generator data), main fc506876, PR 6d8b89c9 (same code as the rebased head). 17 captures, 415 s.

page range backend requests main = PR (identical) PR vs Loki (identical) settled
dd-fields 1h 18 18/18 14/18 identical, 4 explained, 1 history-dependent yes
dd-labels-namespace 15m 7 7/7 3/7 identical, 3 explained, 1 history-dependent yes
dd-labels-namespace 1h 7 7/7 3/7 identical, 3 explained, 1 history-dependent yes
dd-labels-namespace 6h 7 7/7 n/a (Loki holds 1.5h) yes
dd-labels 15m 16 16/16 12/16 identical, 3 explained, 1 history-dependent yes
dd-labels 1h 16 16/16 12/16 identical, 3 explained, 1 history-dependent yes
dd-labels 6h 16 16/16 n/a (Loki holds 1.5h) yes
dd-landing 1h 33 33/33 30/33 identical, 3 explained yes
dd-service-logs 1h 7 7/7 3/7 identical, 3 explained, 1 history-dependent yes
explore-label-browser 15m 3 3/3 3/3 identical yes
explore-label-browser 1h 3 3/3 3/3 identical yes
explore-label-browser 6h 3 3/3 n/a (Loki holds 1.5h) yes
explore-log-context 15m 7 7/7 6/7 identical, 1 explained yes
explore-log-context 1h 7 7/7 6/7 identical, 1 explained yes
explore-log-context 6h 7 7/7 n/a (Loki holds 1.5h) yes
explore-logs-plain 1h 4 4/4 3/4 identical, 1 explained yes
explore-metric-plain 1h 3 3/3 2/3 identical, 1 explained yes
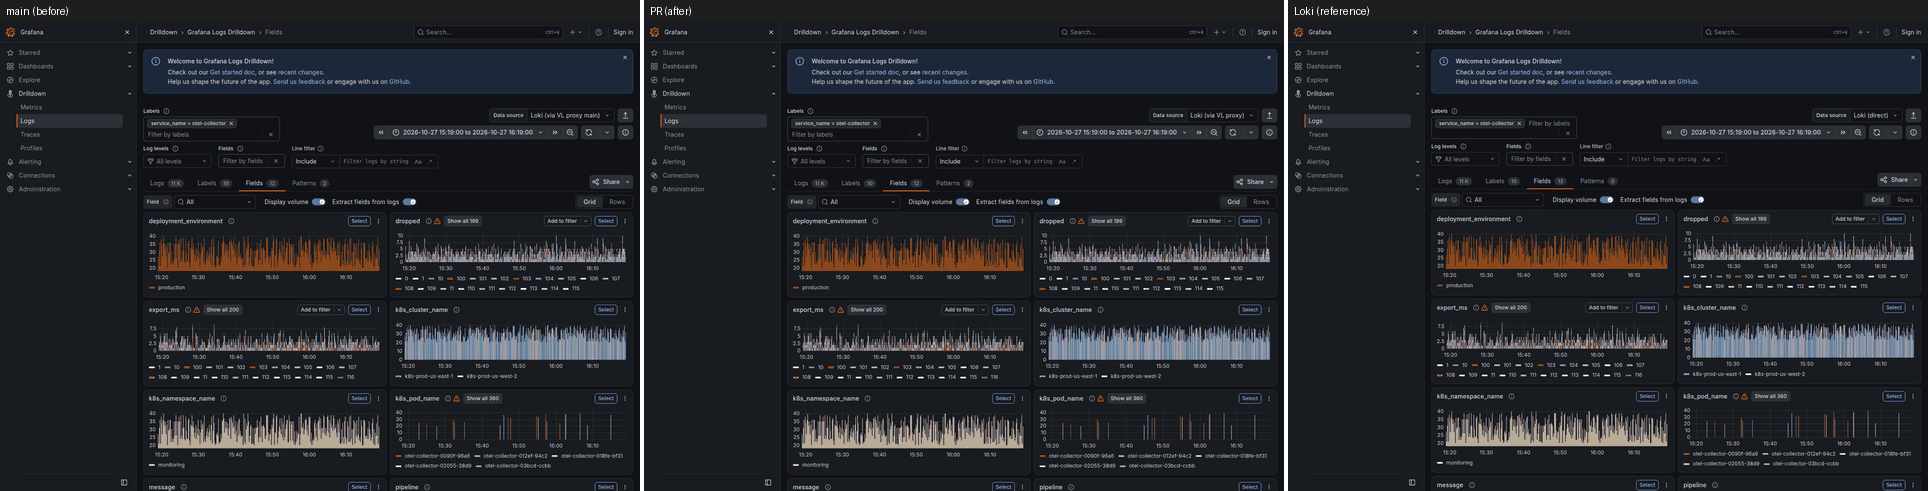
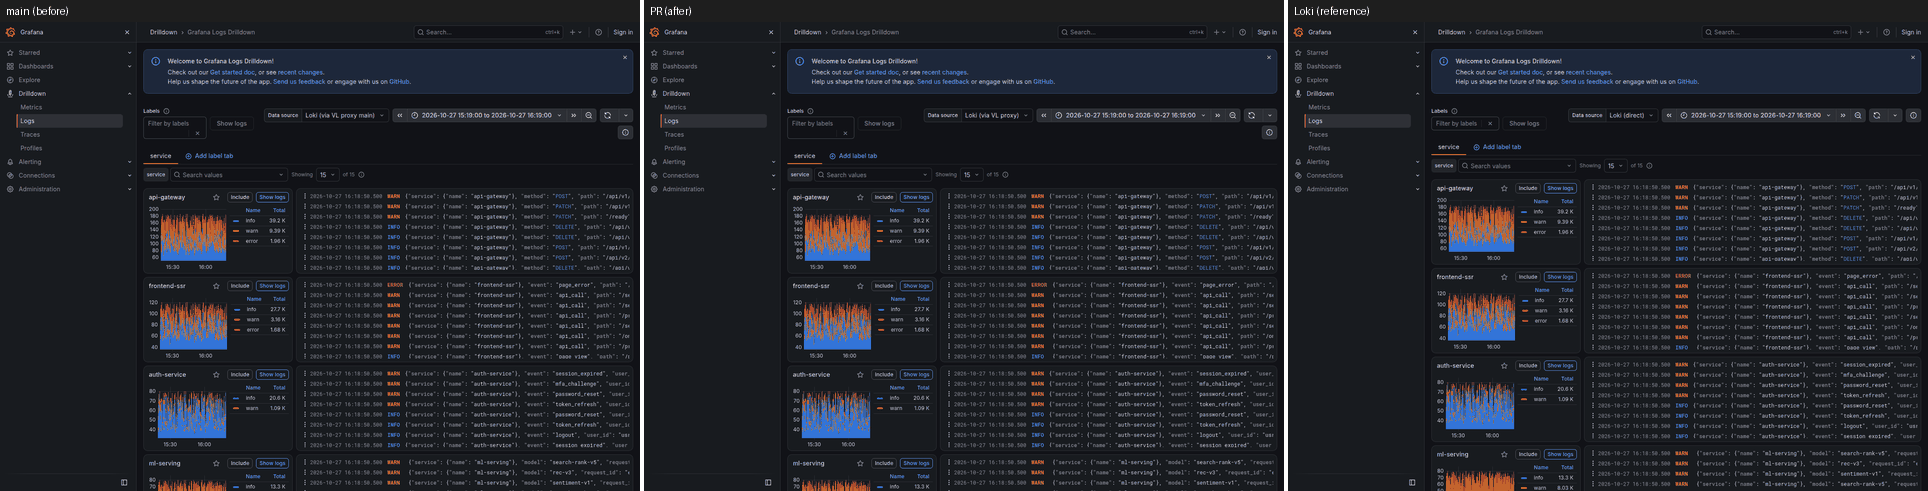
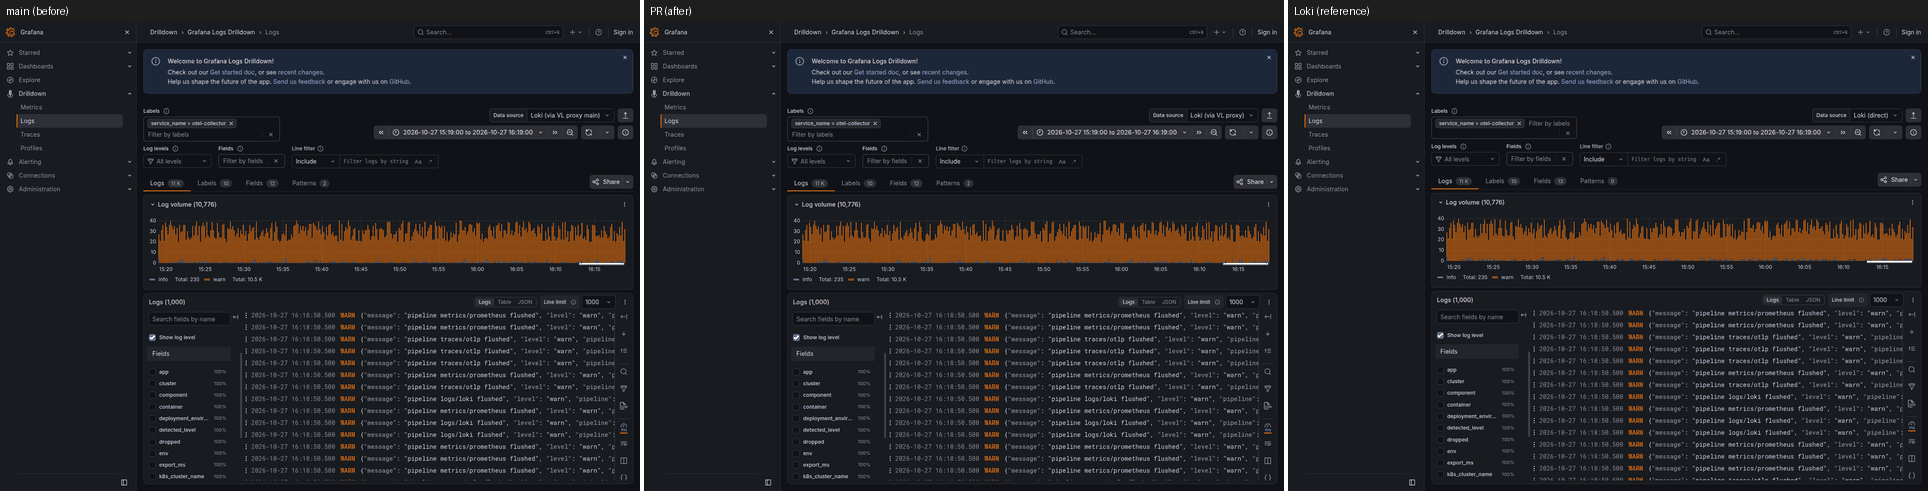
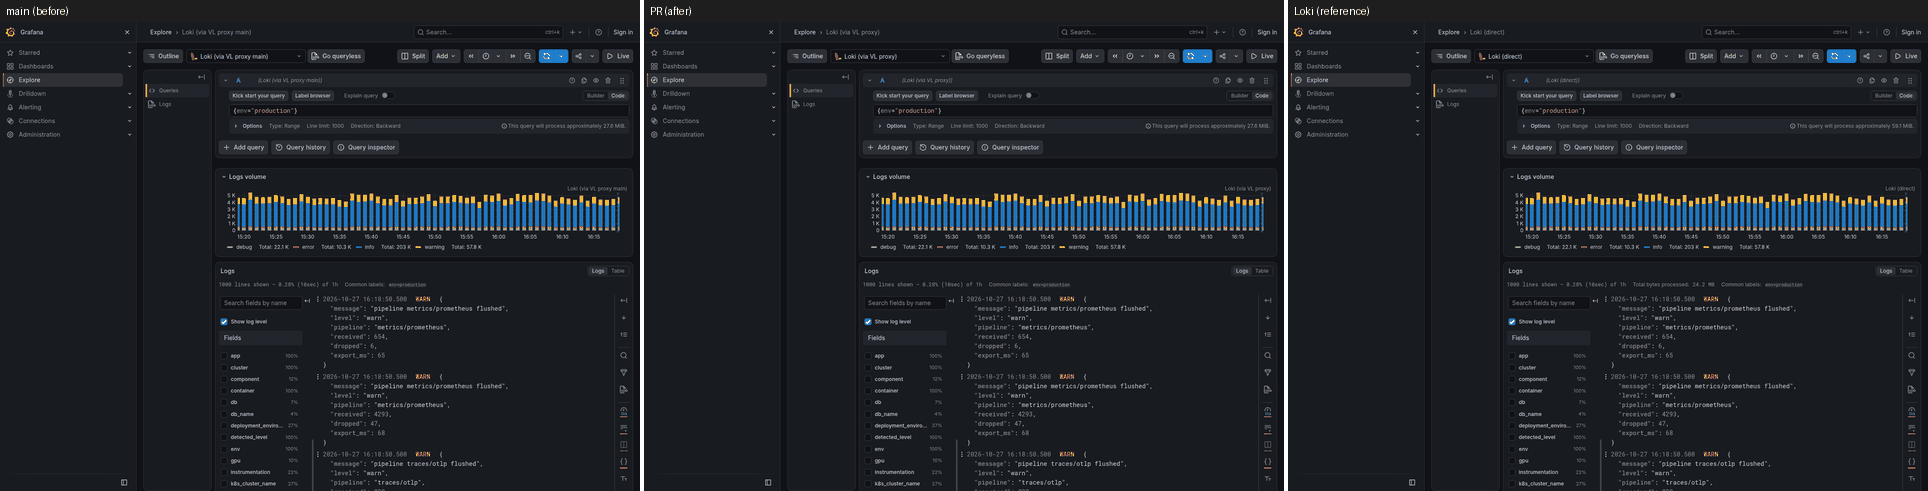
  • main against PR: every backend request Grafana made is identical on all 17 captures (145 of 145).
  • PR against Loki: identical or explained on every capture; the explained rows are the existing documented classes (detected_fields _extracted naming, sampled detected_labels cardinality, configuration probes) and are the same on main. 6 h has no Loki reference (Loki holds 1.5 h).
  • Highest pixel difference main against PR: 0.13% (Drilldown landing), label browser 0.02%.
  • Images: vis-lbl/montage/*.png (17 files, 1.1 MB), vis-lbl/compare.md, vis-lbl/pixeldiff.json.

Pending before ready

Open questions

  • Should there be an operator cap on concurrent background edge refreshes across keys, beyond one per key and the backend budget? It would be a new flag and registry entry.
  • /series follow-up: a response cache and inventory treatment, so the same bound can apply.

@github-actions github-actions Bot added size/XL Extra large change scope/proxy Proxy core scope/helm Helm chart scope/docs Documentation scope/cli CLI flags scope/tests Tests performance Performance labels Oct 27, 2026
@github-actions

github-actions Bot commented Oct 27, 2026 •

Copy link
Copy Markdown
Contributor

⚪ Performance A/B: no change beyond noise

41 shape×range — 41 ⚪ same · results vs Loki: 38 same, 0 new difference(s), 3 pre-existing

Every shape is within noise of the base build (±30% and 100 ms).

41 unchanged shape×range (within noise)
shape range base p50 PR p50 change Loki p50 PR ÷ Loki result vs Loki
⚪ by service_name 1h 9 ms 9 ms ⚪ +0% 39 ms 0.23× ✅ same
⚪ bytes_over_time by app 1h 16 ms 20 ms ⚪ +25% 79 ms 0.25× ✅ same
⚪ detected_level volume 1h 17 ms 18 ms ⚪ +6% 38 ms 0.47× ✅ same
⚪ drilldown detected_level 1h 10 ms 10 ms ⚪ +0% 27 ms 0.37× ✅ same
⚪ drilldown level volume 1h 6 ms 5 ms ⚪ -17% 28 ms 0.18× ✅ same
⚪ drilldown service landing 1h 7 ms 8 ms ⚪ +14% 29 ms 0.28× ✅ same
⚪ instant json filtered instant 31 ms 36 ms ⚪ +16% 73 ms 0.49× ✅ same
⚪ instant json volume instant 23 ms 29 ms ⚪ +26% 93 ms 0.31× ✅ same
⚪ instant ungrouped rate instant 5 ms 5 ms ⚪ +0% 73 ms 0.07× ✅ same
⚪ json rate by level (no filter, no drop) 1h 400 400 ⚪ +0% 400 — ✅ same
⚪ json volume no filters 1h 66 ms 68 ms ⚪ +3% 57 ms 1.19× ✅ same
⚪ logfmt count by level, filter, drop 1h 39 ms 41 ms ⚪ +5% 49 ms 0.84× ✅ same
⚪ logfmt volume 1h 144 ms 142 ms ⚪ -1% 56 ms 2.54× ✅ same
⚪ logs plain 1h 55 ms 50 ms ⚪ -9% 377 ms 0.13× ✅ same
⚪ logs | json 1h 80 ms 76 ms ⚪ -5% 67 ms 1.13× ✅ same
⚪ logs | logfmt 1h 133 ms 119 ms ⚪ -11% 54 ms 2.20× ✅ same
⚪ plain volume 1h 7 ms 6 ms ⚪ -14% 41 ms 0.15× ✅ same
⚪ stream-label count by app 1h 9 ms 9 ms ⚪ +0% 42 ms 0.21× ✅ same
⚪ topk rate by app 1h 34 ms 35 ms ⚪ +3% 76 ms 0.46× ➖ differs (as base)
⚪ ungrouped rate 1h 5 ms 5 ms ⚪ +0% 83 ms 0.06× ✅ same
⚪ LF28 logs, keep detected_level 1h 41 ms 39 ms ⚪ -5% 14 ms 2.79× ✅ same
⚪ LF29 logs, drop detected_level 1h 63 ms 58 ms ⚪ -8% 14 ms 4.14× ✅ same
⚪ LF30 logs, drop level 1h 60 ms 56 ms ⚪ -7% 15 ms 3.73× ✅ same
⚪ LF31 count by detected_level, level dropped 1h 12 ms 12 ms ⚪ +0% 13 ms 0.92× ✅ same
⚪ LF32 count by detected_level, detected_level kept 1h 7 ms 7 ms ⚪ +0% 11 ms 0.64× ✅ same
⚪ LS1 logs, level stream label 1h 44 ms 41 ms ⚪ -7% 58 ms 0.71× ✅ same
⚪ LS2 logs, level stream label regexp, all services 1h 77 ms 68 ms ⚪ -12% 51 ms 1.33× ✅ same
⚪ LS3 logs, level in the selector 1h 38 ms 37 ms ⚪ -3% 19 ms 1.95× ✅ same
⚪ LS6 level stream label count 1h 3 ms 3 ms ⚪ +0% 32 ms 0.09× ✅ same
⚪ label values env ending now 1h 13 ms 14 ms ⚪ +8% 19 ms 0.74× ✅ same
⚪ label values env ending two days ago (control) 1h 3 ms 2 ms ⚪ -33% 2 ms 1.00× ➖ differs (as base)
⚪ labels ending now 1h 8 ms 8 ms ⚪ +0% 2 ms 4.00× ✅ same
⚪ labels ending two days ago (control) 1h 1 ms 1 ms ⚪ +0% 2 ms 0.50× ➖ differs (as base)
⚪ explore label values env 1h 10 ms 10 ms ⚪ +0% 19 ms 0.53× ✅ same
⚪ explore label values service_name 1h 5 ms 5 ms ⚪ +0% 23 ms 0.22× ✅ same
⚪ explore labels (label browser) 1h 7 ms 7 ms ⚪ +0% 2 ms 3.50× ✅ same
⚪ explore labels with selector 1h 7 ms 7 ms ⚪ +0% 22 ms 0.32× ✅ same
⚪ refresh label values env 1h 22 ms 25 ms ⚪ +14% 20 ms 1.25× ✅ same
⚪ refresh label values service_name 1h 10 ms 11 ms ⚪ +10% 24 ms 0.46× ✅ same
⚪ refresh labels (label browser) 1h 14 ms 13 ms ⚪ -7% 2 ms 6.50× ✅ same
⚪ refresh labels with selector 1h 14 ms 14 ms ⚪ +0% 23 ms 0.61× ✅ same
Cold (first-run) timings — what a user opening a panel sees
shape range base cold PR cold Loki cold PR ÷ Loki cold
by service_name 1h 25 ms 25 ms 475 ms 0.05×
bytes_over_time by app 1h 52 ms 50 ms 523 ms 0.10×
detected_level volume 1h 85 ms 85 ms 559 ms 0.15×
drilldown detected_level 1h 55 ms 78 ms 627 ms 0.12×
drilldown level volume 1h 11 ms 17 ms 527 ms 0.03×
drilldown service landing 1h 32 ms 23 ms 464 ms 0.05×
instant json filtered instant 34 ms 33 ms 73 ms 0.45×
instant json volume instant 41 ms 40 ms 93 ms 0.43×
instant ungrouped rate instant 5 ms 5 ms 74 ms 0.07×
json rate by level (no filter, no drop) 1h 400 400 400 —
json volume no filters 1h 163 ms 150 ms 620 ms 0.24×
logfmt count by level, filter, drop 1h 336 ms 333 ms 902 ms 0.37×
logfmt volume 1h 171 ms 162 ms 862 ms 0.19×
logs plain 1h 100 ms 84 ms 563 ms 0.15×
logs | json 1h 128 ms 127 ms 1.03 s 0.12×
logs | logfmt 1h 137 ms 144 ms 59 ms 2.44×
plain volume 1h 14 ms 15 ms 491 ms 0.03×
stream-label count by app 1h 18 ms 21 ms 479 ms 0.04×
topk rate by app 1h 32 ms 39 ms 505 ms 0.08×
ungrouped rate 1h 9 ms 9 ms 627 ms 0.01×
LF28 logs, keep detected_level 1h 78 ms 72 ms 17 ms 4.24×
LF29 logs, drop detected_level 1h 107 ms 118 ms 14 ms 8.43×
LF30 logs, drop level 1h 90 ms 91 ms 15 ms 6.07×
LF31 count by detected_level, level dropped 1h 43 ms 34 ms 143 ms 0.24×
LF32 count by detected_level, detected_level kept 1h 20 ms 20 ms 126 ms 0.16×
LS1 logs, level stream label 1h 48 ms 44 ms 57 ms 0.77×
LS2 logs, level stream label regexp, all services 1h 71 ms 77 ms 61 ms 1.26×
LS3 logs, level in the selector 1h 32 ms 37 ms 20 ms 1.85×
LS6 level stream label count 1h 8 ms 8 ms 334 ms 0.02×
label values env ending now 1h 79 ms 74 ms 19 ms 3.89×
label values env ending two days ago (control) 1h 5 ms 5 ms 2 ms 2.50×
labels ending now 1h 60 ms 51 ms 2 ms 25.50×
labels ending two days ago (control) 1h 3 ms 3 ms 2 ms 1.50×
explore label values env 1h 71 ms 69 ms 19 ms 3.63×
explore label values service_name 1h 32 ms 30 ms 23 ms 1.30×
explore labels (label browser) 1h 22 ms 17 ms 2 ms 8.50×
explore labels with selector 1h 53 ms 50 ms 22 ms 2.27×
refresh label values env 1h 3 ms 3 ms 19 ms 0.16×
refresh label values service_name 1h 2 ms 2 ms 23 ms 0.09×
refresh labels (label browser) 1h 2 ms 2 ms 2 ms 1.00×
refresh labels with selector 1h 2 ms 2 ms 24 ms 0.08×
5 shape×range above 2× Loki already (listed, or as slow on the base build)
mode shape range PR Loki PR ÷ Loki base ÷ Loki listed ÷ Loki why
known cold logs | logfmt 1h 144 ms 59 ms 2.44× 2.32× — as slow on base
known warm logs | logfmt 1h 119 ms 54 ms 2.20× 2.46× — as slow on base
known warm logfmt volume 1h 142 ms 56 ms 2.54× 2.57× — as slow on base
known cold LF29 logs, drop detected_level 1h 118 ms 14 ms 8.43× 7.64× — as slow on base
known cold LF30 logs, drop level 1h 91 ms 15 ms 6.07× 6.00× — as slow on base
Why these shapes
  • cmd/proxy/main.go → 20: control/by service_name, control/bytes_over_time by app, control/detected_level volume, control/drilldown detected_level, control/drilldown level volume, control/drilldown service landing, control/instant json filtered, control/instant json volume …
  • internal/proxy/label_handlers.go → 17: level-filter-stored/LS1 logs, level stream label, level-filter-stored/LS2 logs, level stream label regexp, all services, level-filter-stored/LS3 logs, level in the selector, level-filter-stored/LS6 level stream label count, level-filter/LF28 logs, keep detected_level, level-filter/LF29 logs, drop detected_level, level-filter/LF30 logs, drop level, level-filter/LF31 count by detected_level, level dropped …
  • internal/proxy/label_metadata.go → 12: metadata-freshness/label values env ending now, metadata-freshness/label values env ending two days ago (control), metadata-freshness/labels ending now, metadata-freshness/labels ending two days ago (control), metadata-inventory/explore label values env, metadata-inventory/explore label values service_name, metadata-inventory/explore labels (label browser), metadata-inventory/explore labels with selector …
  • control smoke → 8: control/drilldown service landing, control/instant ungrouped rate, control/json rate by level (no filter, no drop), control/json volume no filters, control/logs plain, control/logs | json, control/stream-label count by app, control/topk rate by app
  • internal/proxy/proxy.go (endpoint handler) → 8: control/drilldown service landing, control/instant ungrouped rate, control/json rate by level (no filter, no drop), control/json volume no filters, control/logs plain, control/logs | json, control/stream-label count by app, control/topk rate by app
  • internal/config/limits.go → 4: metadata-inventory/refresh label values env, metadata-inventory/refresh label values service_name, metadata-inventory/refresh labels (label browser), metadata-inventory/refresh labels with selector
  • internal/config/registry.go → 4: metadata-inventory/refresh label values env, metadata-inventory/refresh label values service_name, metadata-inventory/refresh labels (label browser), metadata-inventory/refresh labels with selector

base b59250df35 → PR fd472f7ec2 · 4 runs (first is cold), warm p50 · ranges 1h · noise ±30% and 100 ms · VictoriaLogs restarts 0→0 · 5.2 min. Same runner, one fresh stack, targets interleaved per request. How to read and reproduce: bench/ab/README.md.

@github-actions

github-actions Bot commented Oct 27, 2026 •

Copy link
Copy Markdown
Contributor

✅ Visual smoke: passed

Base b59250df35 vs PR 230574ece2, Grafana through the proxy builds and Loki on one fresh stack; run.
Core set: 5 capture(s) at 1h. Detailed set: 20 entries (lvl-dd-fields-pill, lvl-dd-field-method-pill, lvl-dd-field-pipeline-pill, lvl-dd-labels-pill, lvl-dd-label-pod-pill, lvl-explore-logs-level-label-stored, lvl-explore-logs-level-selector-stored, lvl-explore-logs-keep-dl, ...). 26 capture(s), 15m/1h/6h, 24h and 7d stay out of PR runs.
Trimmed to the 1h range for the capture budget: explore-label-browser, explore-log-context, dd-labels, dd-labels-namespace, dd-field-service_version, dd-field-pipeline.

page range set base = PR (data) vs Loki (PR) pixel diff result
dd-fields 1h core ✅ identical identical (4 explained, 1 history-dependent) 0.12% ✅
dd-landing 1h core ✅ identical identical (3 explained) 0.14% ✅
dd-service-logs 1h core ✅ identical identical (3 explained, 1 history-dependent) 0.12% ✅
explore-logs-plain 1h core ✅ identical identical (1 explained) 0.07% ✅
explore-metric-plain 1h core ✅ identical identical (1 explained) 0.04% ✅
dd-field-pipeline 1h detailed ✅ identical identical (3 explained, 1 history-dependent) 0.12% ✅
dd-field-service_version 1h detailed ✅ identical identical (3 explained, 1 history-dependent) 0.12% ✅
dd-fields 15m detailed ✅ identical identical (4 explained, 1 history-dependent) 0.11% ✅
dd-fields 6h detailed ✅ identical n/a (beyond the Loki window) 0.11% ✅
dd-labels 1h detailed ✅ identical identical (3 explained, 1 history-dependent) 0.12% ✅
dd-labels-namespace 1h detailed ✅ identical identical (3 explained, 1 history-dependent) 0.12% ✅
explore-label-browser 1h detailed ✅ identical identical 0.02% ✅
explore-log-context 1h detailed ✅ identical identical (1 explained) 0.04% ✅
lvl-dd-field-method-pill 1h detailed ✅ identical 1 difference(s), 1 on base too; 2 explained 0.11% ✅
lvl-dd-field-pipeline-pill 1h detailed ✅ identical 1 difference(s), 1 on base too; 2 explained, 1 history-dependent 0.12% ✅
lvl-dd-fields-pill 1h detailed ✅ identical 25 difference(s), 25 on base too; 4 explained 0.11% ✅
lvl-dd-label-pod-pill 1h detailed ✅ identical 1 difference(s), 1 on base too; 2 explained, 1 history-dependent 0.12% ✅
lvl-dd-labels-pill 1h detailed ✅ identical 2 difference(s), 2 on base too; 2 explained 0.11% ✅
lvl-explore-logs-drop-dl 1h detailed ✅ identical 2 difference(s), 2 on base too; 1 explained 0.07% ✅
lvl-explore-logs-drop-level 1h detailed ✅ identical 1 difference(s), 1 on base too; 1 explained 0.07% ✅
lvl-explore-logs-keep-dl 1h detailed ✅ identical 1 difference(s), 1 on base too; 1 explained 0.07% ✅
lvl-explore-logs-level-label-stored 1h detailed ✅ identical identical (1 explained) 0.07% ✅
lvl-explore-logs-level-selector-stored 1h detailed ✅ identical identical (1 explained) 0.07% ✅
lvl-explore-volume-drop-level 1h detailed ✅ identical identical (1 explained) 0.04% ✅
lvl-explore-volume-keep-dl 1h detailed ✅ identical identical (1 explained) 0.04% ✅
lvl-explore-volume-level-label-stored 1h detailed ✅ identical identical (1 explained) 0.04% ✅

Gate: a base-vs-PR data difference passes when the PR is closer to Loki, and fails when the PR diverges from Loki or Loki cannot decide it (at a range Loki does not hold, a difference passes when the same page proved it closer to Loki at a shorter range; otherwise label the pull request visual-change-expected to accept an intended change). Also failing: a panel empty on the PR but not on the base, an error banner, panel error, error answer or new "No data" panel on the PR, a PR side that never settled, a difference that did not reproduce on the recapture. Pixel differences only warn.

Core set montages (5): base | PR | Loki

dd-fields-1h

dd-fields-1h

dd-landing-1h

dd-landing-1h

dd-service-logs-1h

dd-service-logs-1h

explore-logs-plain-1h

explore-logs-plain-1h

explore-metric-plain-1h

explore-metric-plain-1h

All montages of this run: pr-visuals/pr-877.

@github-actions

github-actions Bot commented Oct 27, 2026 •

Copy link
Copy Markdown
Contributor

PR Quality Report

Compared against base branch main.

Coverage and tests

Signal Base PR Delta
Test count 15047 15059 12
Coverage 88.6% 88.6% 0.0% (stable)

Compatibility

Track Base PR Delta
Loki API 100.0% 11/11 (100.0%) 0.0% (stable)
Logs Drilldown 100.0% 17/17 (100.0%) 0.0% (stable)
VictoriaLogs 100.0% 11/11 (100.0%) 0.0% (stable)

Performance smoke

Lower CPU cost (ns/op) is better. Lower benchmark memory cost (B/op, allocs/op) is better. Higher throughput is better. Lower load-test memory growth is better. Benchmark rows are medians from repeated samples.

Signal Base PR Delta
QueryRange cache-hit CPU cost 2265.0 ns/op 2076.0 ns/op -8.3% (stable)
QueryRange cache-hit memory 1240.0 B/op 1240.0 B/op 0.0% (stable)
QueryRange cache-hit allocations 27.0 allocs/op 27.0 allocs/op 0.0% (stable)
QueryRange cache-bypass CPU cost 2528.0 ns/op 2484.0 ns/op -1.7% (stable)
QueryRange cache-bypass memory 1284.0 B/op 1282.0 B/op -0.2% (stable)
QueryRange cache-bypass allocations 27.0 allocs/op 27.0 allocs/op 0.0% (stable)
Labels cache-hit CPU cost 683.6 ns/op 615.9 ns/op -9.9% (stable)
Labels cache-hit memory 48.0 B/op 48.0 B/op 0.0% (stable)
Labels cache-hit allocations 3.0 allocs/op 3.0 allocs/op 0.0% (stable)
Labels cache-bypass CPU cost 1058.0 ns/op 1014.0 ns/op -4.2% (stable)
Labels cache-bypass memory 397.0 B/op 396.0 B/op -0.3% (stable)
Labels cache-bypass allocations 14.0 allocs/op 14.0 allocs/op 0.0% (stable)

State

  • Coverage, compatibility, and sampled performance are reported here from the same PR workflow.
  • This is a delta report, not a release gate by itself. Required checks still decide merge safety.
  • Performance is a smoke comparison, not a full benchmark lab run.
  • Delta states use the same noise guards as the quality gate (percent + absolute + low-baseline checks), so report labels match merge-gate behavior.

…most 10s old

Every Grafana refresh of /labels or /label/{name}/values ending within
-max-metadata-cache-freshness of now, once its cached answer was older than
-recent-tail-refresh-max-staleness (2s), read the near-now edge from
VictoriaLogs synchronously. The settled buckets come from the metadata
inventory, but under 32 heavy clients that edge call (stream_field_names)
waited 0.35-0.6 s at p95 and up to 2.6 s for VictoriaLogs CPU (360-470 % on
average), so /labels p95 was 50-450 ms against 5-40 ms on an idle
VictoriaLogs. The proxy never queued it; VictoriaLogs did.

Such a request now starts the refresh detached from itself and waits at
most -metadata-edge-refresh-budget (default 100ms) for it: an idle
VictoriaLogs still answers exactly. Otherwise the request gets the last
answer this replica read for the same tenant, auth scope and window, if
that read started at most -metadata-max-staleness (default 10s) ago,
marked X-Proxy-Stale-Response so the compatibility-edge and multi-tenant
caches never keep it. The refresh completes in the background (one per
cache key, sharing the listing fetch with synchronous waiters, within the
background timeout, cancelled by Shutdown) and the next request lists what
it found. Past the bound, or without such an answer, the request waits for
VictoriaLogs as before; requests ending earlier read settled data and are
never stale. Staleness is measured from the start of the VictoriaLogs read
behind the stored answer (syncFetchStringsAt returns the leader's start).

Loki lists labels from its index and ingesters
(pkg/querier/querier.go:307-342) and does not cache a metadata answer
ending within max_metadata_cache_freshness
(pkg/querier/queryrange/series_cache.go:111-125), so this bound is a
documented deviation the owner approved; -metadata-max-staleness=0 restores
exact answers. The 10s default: VictoriaLogs makes rows searchable within
about a second (lib/logstorage/datadb.go:776 in v1.49.0, :780 in v1.53.0)
and Grafana's shortest dashboard refresh is 5s. /series has no response
cache or inventory and is not affected.

The label handlers now build their answer in one closure used by both the
synchronous path and the detached refresh (the service_name values path
folds into it and keeps its own browse-window rule). A follower of a shared
listing fetch whose leader ran out of its own deadline retries, as it did
for a cancelled leader.

An empty answer (a negative entry) and a disk or peer copy are never
served stale. The e2e freshness test
(TestCompat_LabelsIncludeStreamWrittenAfterCaching) now asks again after
the bound instead of after 3 s, since within it a slow refresh may answer
from the answers read before its second stream.

Metrics: internal_operation{operation="metadata_edge_answer"} (exact,
stale, waited), {operation="metadata_edge_staleness"} (age of each stale
answer) and {operation="metadata_edge_refresh"} (background refresh).

Registry: quality/metadata-bounded-staleness (owner-kept).
The first /labels for a warmed preset after a warm-up pass still waited for
its edge refresh: the warm answer was in the cache, but no read time was
recorded for it, so -metadata-max-staleness could not apply. Under load that
first request paid the same 0.35-2.6 s VictoriaLogs wait as an unwarmed one.

warmLabelWindows now records when each window's read started, after the
answer is stored (an empty answer stores nothing and records nothing), and
the read skips the short-lived exact-window field-name cache like a
background refresh, so the recorded start is the age of the data. The first
request after a pass is then answered within -metadata-edge-refresh-budget:
exactly, or from the warm answer if the warm read started within the bound.

Test: after the 1h preset is warmed, the first Grafana-shaped /labels with
VictoriaLogs holding its edge refresh is answered within the 50 ms budget
from the warm answer, marked stale, and starts the refresh.

Registry: quality/metadata-bounded-staleness.
@szibis
szibis force-pushed the perf/labels-inventory-first branch from a6d11ef to 230574e Compare October 27, 2026 16:18
@github-actions github-actions Bot added size/XL Extra large change and removed size/XL Extra large change labels Oct 27, 2026
@szibis
szibis merged commit a3d0cb5 into main Oct 27, 2026
47 checks passed
@szibis
szibis deleted the perf/labels-inventory-first branch October 27, 2026 16:26
Sign up for free to join this conversation on GitHub. Already have an account? Sign in to comment

Labels

performance Performance scope/cli CLI flags scope/docs Documentation scope/helm Helm chart scope/proxy Proxy core scope/tests Tests size/XL Extra large change

Projects

None yet

Development

Successfully merging this pull request may close these issues.

1 participant