


The TSForecasting project offers a comprehensive and integrated pipeline designed to Automate Time Series Forecasting applications. By implementing multivariate approaches that incorporate multiple regression models, it combines varied relevant modules such as SKLearn, AutoGluon, CatBoost and XGBoost, following an Expanding Window structured approach for performance evaluation ensuring a robust, scalable and optimized forecasting solution.
The architecture design includes five main sections: data preprocessing, feature engineering, hyperparameter optimization, model evaluation and forecasting, which are organized and customizable in a pipeline structure.
This project aims at providing the following application capabilities:
-
General applicability on tabular datasets: The developed forecasting procedures are applicable on any data table associated with any Time Series Forecasting scopes.
-
Hyperparameter optimization and customization: It provides full configuration for each model hyperparameter through the customization of
model_configurationsdictionary, allowing optimal performance to be obtained for any use case. -
Robustness and improvement of predictive results: The implementation of the TSForecasting pipeline aims to improve the predictive performance directly associated with the application of the best performing forecasting method.
-
Prediction intervals with multiple methods: Four coverage levels (80%, 90%, 95%, 99%) with four estimation methods (ensemble, quantile, conformal, gaussian) for robust uncertainty quantification.
Major frameworks used to build this project:
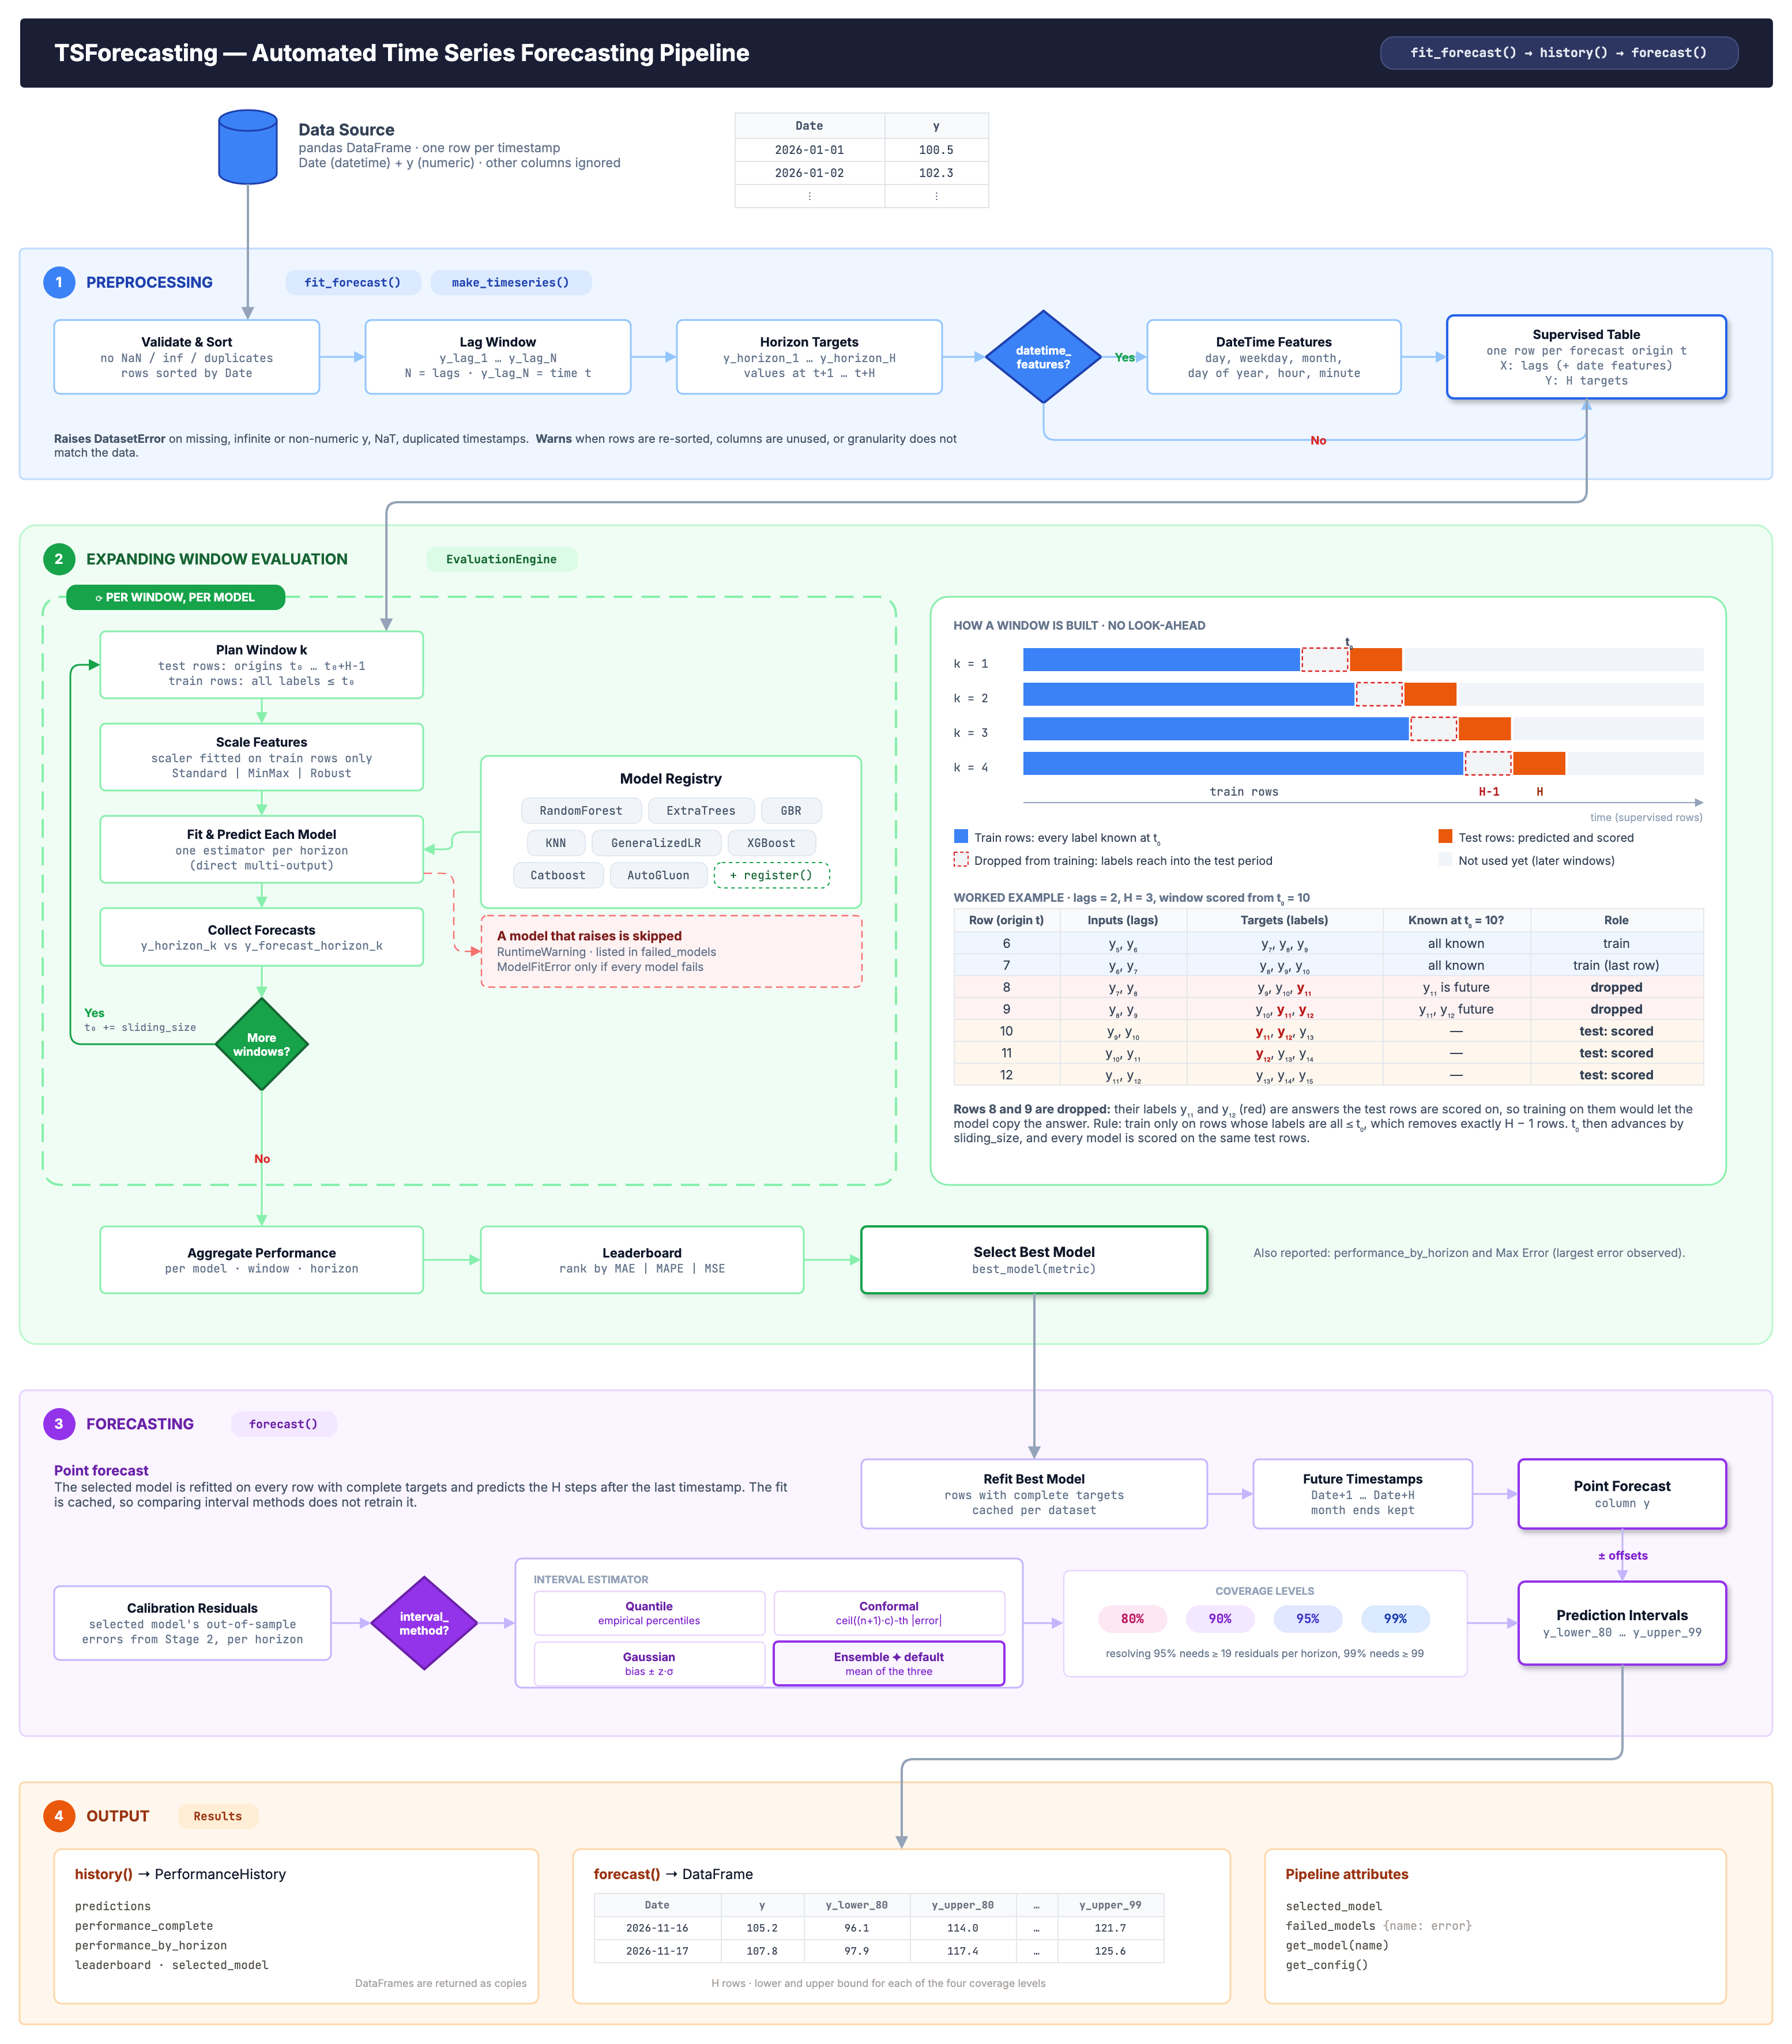
The pipeline runs in four stages:
- Preprocessing: validates the input (rows sorted by date; missing values and duplicated timestamps rejected) and turns the series into a supervised table of lag features and multi-step horizon targets, with optional datetime features.
- Expanding Window Evaluation: the training set grows by
sliding_sizeon each iteration and the nexthorizonsteps are forecast. Thehorizon - 1rows whose targets reach past the forecast origin are purged, so scores are free of look-ahead leakage. The scaler is fitted on each window's training rows only, and a model that fails is skipped and reported infailed_models. - Model Selection: errors (MAE, MAPE, MSE, Max Error) are aggregated across windows and horizons into a leaderboard, and the best model by the chosen
metricis selected. - Forecasting: the selected model is refitted on every row with complete targets and predicts the future timestamps, with prediction intervals at 80%, 90%, 95% and 99% coverage (
ensemble,quantile,conformalorgaussian).
Binary installer for the latest released version is available at the Python Package Index (PyPI).
To install this package from Pypi repository run the following command:
pip install tsforecasting
Python 3.10 or newer is required.
The first step after importing the package is to load a dataset and define your DateTime (datetime64[ns] type) and Target column to be predicted, then rename them to Date and y, respectively.
Input data requirements: one row per timestamp at regular spacing, a datetime Date column and a numeric y column without missing values. Rows are sorted chronologically when needed (with a warning); duplicated timestamps, missing or non-numeric targets raise a DatasetError with a description of the problem. Columns other than Date and y are ignored.
The pipeline follows a straightforward workflow: configure parameters, fit the model across expanding windows, evaluate performance, and generate forecasts with prediction intervals. The fit_forecast method trains and evaluates all selected models using the expanding window approach, automatically selecting the best performer. The history method returns detailed performance metrics across all windows and horizons, while forecast generates future predictions using the best model.
Pipeline Parameters:
train_size: Proportion of data used for the initial training window (0.3 <= train_size < 1.0)lags: Number of lag features (window size) - how many past observations each input sample includeshorizon: Number of future time steps to forecastsliding_size: Window expansion size per iteration (sliding_size >= horizonrecommended)models: List of models to evaluate (names are case-insensitive). Available options:RandomForest,ExtraTrees,GBR,KNN,GeneralizedLRXGBoost,Catboost,AutoGluon- any model added with
ModelRegistry.register(see Custom Models)
hparameters: Nested dictionary containing model-specific hyperparameter configurations (customizable viamodel_configurations())granularity: Time frequency of the data -1m,30m,1h,1d,1wk,1mo(default:1d). It drives the timestamps of the forecast; a warning is raised when it does not match the spacing ofDatemetric: Evaluation metric for model selection -MAE,MAPE, orMSE(default:MAE)scaler: Feature scaler -standard,minmax,robust(default:standard)datetime_features: Whether date-based features are added to the lag features (default:True)verbose: Whether evaluation progress is printed (default:True)
Invalid parameters raise a ConfigurationError (an unknown model raises ModelNotFoundError), both when constructing the pipeline and when using the builder.
import warnings
import pandas as pd
from tsforecasting import TSForecasting, model_configurations

warnings.filterwarnings("ignore", category=Warning)

# Load and prepare data
data = pd.read_csv("your_timeseries.csv")
data = data.rename(columns={"DateTime_Column": "Date", "Target_Column": "y"})
data["Date"] = pd.to_datetime(data["Date"])
data = data[["Date", "y"]]

# Get and customize model hyperparameters
hparameters = model_configurations()
hparameters["RandomForest"]["n_estimators"] = 100
hparameters["XGBoost"]["n_estimators"] = 100
hparameters["Catboost"]["iterations"] = 100

# Configure and fit pipeline
tsf = TSForecasting(
    train_size=0.80,
    lags=10,
    horizon=10,
    sliding_size=10,
    models=[
        "RandomForest",
        "ExtraTrees",
        "GBR",
        "KNN",
        "XGBoost",
        "Catboost",
    ],
    hparameters=hparameters,
    granularity="1d",
    metric="MAE",
)
tsf.fit_forecast(dataset=data)

# Get performance history
history = tsf.history()
print(f"Best Model: {tsf.selected_model}")

# A model that raises during evaluation is skipped (with a warning) instead of
# aborting the run; skipped models and their errors are listed here
print(tsf.failed_models)

# Generate forecast with prediction intervals
forecast = tsf.forecast()
print(forecast[["Date", "y", "y_lower_90", "y_upper_90"]])The history() method returns a PerformanceHistory dataclass containing detailed evaluation results essential for analyzing forecasting performance across models, windows, and horizons.
# Access history components
history = tsf.history()

# 1. Predictions DataFrame - Raw forecasts per window with timestamps
predictions = history.predictions
print(f"Shape: {predictions.shape}")
print(predictions.head())
# Columns: Date, y_horizon_1..N, y_forecast_horizon_1..N, Window, Model

# 2. Complete Performance - Detailed metrics per window and horizon
performance_complete = history.performance_complete
print(performance_complete.head(10))
# Columns: Model, Window, Horizon, Mean Absolute Error,
#          Mean Absolute Percentage Error, Mean Squared Error, Max Error

# 3. Performance by Horizon - Aggregated metrics across windows per horizon
performance_horizon = history.performance_by_horizon
print(performance_horizon)
# Useful for understanding error growth over forecast horizon

# 4. Leaderboard - Model rankings by selected metric
leaderboard = history.leaderboard
print(leaderboard.to_string(index=False))
# Models ranked by mean performance across all windows
# ("Max Error" reports the largest single error observed)

# 5. Selected Model
print(f"Best Model: {history.selected_model}")For more readable configuration, use the fluent builder pattern:
from tsforecasting import TSForecastingBuilder

tsf = (TSForecastingBuilder()
       .with_train_size(0.80)
       .with_lags(10)
       .with_horizon(10)
       .with_sliding_size(10)
       .with_models(['RandomForest', 'XGBoost'])
       .with_granularity('1d')
       .with_metric('MAE')
       .with_preprocessing(scaler='robust', datetime_features=True)
       .build())

tsf.fit_forecast(dataset=data)
forecast = tsf.forecast()TSForecasting generates prediction intervals at four fixed coverage levels: 80%, 90%, 95%, and 99%. Four estimation methods are available:
| Method | Description | Best For |
|---|---|---|
ensemble |
Average of all three methods (default) | General use, most robust |
quantile |
Empirical percentiles of residuals | Asymmetric error distributions |
conformal |
Distribution-free coverage guarantee | Theoretical guarantees |
gaussian |
Parametric normal assumption | Symmetric, well-behaved errors |
Mathematical Formulations:
-
Quantile: Computes empirical percentiles of historical residuals (
lower = forecast + percentile(residuals, α/2)). Captures asymmetric errors without distributional assumptions. -
Conformal: Uses absolute errors as nonconformity scores and takes the
ceil((n + 1) × coverage)-th smallest score (finite-sample correction). Provides coverage guarantees with symmetric, constant-width intervals. -
Gaussian: Assumes normally distributed residuals (
lower = forecast + bias - z × std). Efficient and accounts for systematic bias. -
Ensemble (Default): Averages bounds from all three methods, balancing their strengths for robust uncertainty estimates.
# Default: ensemble method (recommended)
forecast = tsf.forecast()

# Specific methods
forecast = tsf.forecast(interval_method="quantile")
forecast = tsf.forecast(interval_method="conformal")
forecast = tsf.forecast(interval_method="gaussian")
The final model fit is cached, so comparing interval methods on the same data does not retrain the model.
Calibration notes: intervals are calibrated per horizon on the out-of-sample residuals of the selected model collected during the expanding window evaluation (n = windows × horizon residuals per horizon).
Empirical bounds cannot extend beyond the most extreme residual observed, so high coverage levels need enough residuals to be resolved - roughly n >= 19 for 95% and n >= 99 for 99%.
With fewer, the 95% and 99% intervals are narrower than their nominal level; use a smaller sliding_size or more data to obtain more evaluation windows.
The make_timeseries method transforms a DataFrame into a supervised learning format ready for time series analysis:
window_size: Number of past observations (lags) each sample includeshorizon: Number of future time steps to predictdatetime_engineering: Enriches dataset with date-time features (year, month, day of week, etc.)
from tsforecasting import Processing

processor = Processing()
timeseries = processor.make_timeseries(
    dataset=data,
    window_size=10,
    horizon=5,
    datetime_engineering=True
)Select most relevant features based on tree-based importance:
from tsforecasting import TreeBasedFeatureSelector

selector = TreeBasedFeatureSelector(
    algorithm='ExtraTrees',      # RandomForest, ExtraTrees, GBR
    relevance_threshold=0.95,    # Keep features explaining 95% of variance
    n_estimators=100
)
selector.fit(X, y)
X_selected = selector.transform(X)
print(selector.selected_features)Any estimator with a scikit-learn style fit/predict can take part in the evaluation: wrap it in a BaseForecaster subclass and register it. Registered models are selected by name like the built-in ones.
from sklearn.linear_model import Ridge
from tsforecasting import BaseForecaster, ModelRegistry, TSForecasting

class RidgeForecaster(BaseForecaster):
    def _create_base_estimator(self):
        return Ridge(**self._params)

ModelRegistry.register("Ridge", RidgeForecaster, default_params={"alpha": 1.0})

tsf = TSForecasting(lags=10, horizon=5, sliding_size=5, models=["Ridge", "RandomForest"])
tsf.fit_forecast(dataset=data)All exceptions derive from TSForecastingError:
| Exception | Raised when |
|---|---|
ConfigurationError |
A pipeline parameter is out of range or not recognised |
ModelNotFoundError |
A model name is not registered |
DatasetError |
The dataset is malformed (missing columns, NaN/non-numeric target, duplicated timestamps) |
InsufficientDataError |
The dataset is too small for the requested lags, horizon, train_size and sliding_size |
ModelFitError |
Every candidate model failed during evaluation |
NotFittedError |
history() or forecast() is called before fit_forecast() |
Input-related errors (ConfigurationError, ModelNotFoundError, DatasetError, InsufficientDataError) are also ValueError subclasses.
TSForecasting Guideline Examples
For a more interactive experience, feel free to explore the Jupyter notebooks with step-by-step execution and guidelines:
If you use TSForecasting in your research, please cite:
@software{tsforecasting,
  author = {Luis Fernando Santos},
  title = {TSForecasting: Automated Time Series Forecasting Framework},
  year = {2022},
  url = {https://github.com/TsLu1s/TSForecasting}
}Distributed under the MIT License. See LICENSE for more information.
Luis Santos - LinkedIn