

Find wasted work in AI agents. Verify each change.
Trace calls, inspect findings, and compare performance with your quality checks.





Documentation · Quickstart · Improve an agent · Trace your code · Compare runs · Integrations · Guide
AgentLoop is a local profiler for AI agents and decision pipelines. It records execution spans, reports latency and token usage, and identifies patterns such as repeated calls, retry loops, and reused context. Compare saved runs to check whether a change improves performance while still passing your output checks.
The core Python SDK and CLI work with JSON files. You can trace and analyze your code without a hosted account or database. A dashboard, HTTP API, and shared storage are available as optional components.
For Node.js and browser applications, the source checkout includes a
TypeScript SDK with native tracing and an API v1 client.
It has no runtime dependencies and installs with npm install agentloop-profiler.
Install with Python 3.11 or newer:
python -m pip install agentloop-profiler
agentloop quickstart
agentloop analyze runs/agentloop_quickstart.json --html runs/report.html --json-out runs/analysis.json
Open runs/report.html in your browser to inspect the timeline and findings.
runs/analysis.json contains the trace, metrics, diagnosis, and optimization plan.
The package name is agentloop-profiler; the Python import and CLI command are
both agentloop. quickstart creates a labeled synthetic trace and makes no model
API calls. It tests your installation, not your application's performance.
If your shell cannot find agentloop, activate the Python environment where you
installed it. Run agentloop doctor to check the installation and available adapters.
For an isolated install, create an environment with python -m venv .venv, then
activate it with source .venv/bin/activate on Linux/macOS or
.\.venv\Scripts\Activate.ps1 in Windows PowerShell before installing the package.
Requires AgentLoop 0.2.0 or newer. Upgrade with
python -m pip install --upgrade agentloop-profiler and check the installed version
with python -m pip show agentloop-profiler.
The example runs locally.
agentloop improve init --out agentloop-demo
cd agentloop-demo
python agentloop_runner.py --check
agentloop improve capture --out baseline -- python agentloop_runner.py
agentloop improve start --baseline baseline/capture.json --out optimization
Read optimization/plan.md. It ranks findings using the existing evidence,
quality-risk and estimated-benefit inputs, and separates observations from
assumptions and missing evidence. In agentloop_example.py, replace the repeated
lookup in answer() with:
value = lookup_note(key)
return {"notes": [value] * 3}
Then capture the same tasks and check the actual result:
agentloop improve capture --out candidate -- python agentloop_runner.py
agentloop improve finish --session optimization/session.json --candidate candidate/capture.json --change "Reuse one lookup per request" --out results
Open results/report.html. The generated example runs real local CPU work on
fictional notes; it is labeled synthetic. Its timings describe this example only.
A faster answer that fails the frozen correctness checks is rejected with exit
code 1. Failed attempts and unknown costs remain in the report.
To connect your application, run agentloop improve init --agent my_agent:answer
in its project directory. The generated adapter supports synchronous and async
Python callables. Replace the example task inputs and expected outputs with
independent checks for your agent, and keep your model and tool instrumentation.
Initialization refuses to overwrite existing files. Read the generated
AGENTLOOP.md and onboarding guide.
A small Hermes case study retained six passing matched comparisons: model calls fell from 12 to 6 and mean task latency from 14.52s to 7.41s. An earlier faster JSON-only candidate failed an independent answer check and was rejected. These controlled repository questions establish example behavior; they do not establish production savings or general agent performance.
The validation guide runs repository, retrieval and tool-heavy pilot/held-out comparisons with offline fixtures or a pinned local model. It retains incorrect controls, negative outcomes and tracing overhead observations. See remaining adoption and measurement gaps. Its first real local-model run rejected the candidate: only 3 of 12 held-out comparisons passed every required gate.
Save this as example_agent.py. It traces local functions and saves their output
for the quality check below. It runs without a model SDK or API key.
import agentloop

NOTES = {
    "tracing": "Record the steps in a workflow.",
    "optimization": "Investigate repeated or expensive work.",
    "replay": "Compare saved baseline and candidate traces.",
}


@agentloop.trace_tool(name="lookup_note")
def lookup_note(topic: str) -> str:
    return NOTES[topic]


with agentloop.trace_agent("research_agent") as trace:
    output = {"notes": [lookup_note(topic) for topic in NOTES]}
    trace.metadata["output"] = output

trace.export_json("runs/research_agent.json")
print(output)
Run it and inspect the recorded calls:
python example_agent.py
agentloop analyze runs/research_agent.json --html runs/research_agent.html
The decorator records duration and status for each call. Wrap your application's functions the same way, or use a framework adapter. SDK adapters can capture provider token usage; a generic decorator cannot infer usage from an arbitrary return value.
Saving metadata["output"] is an explicit choice in this example. Review the
inputs, outputs, errors, and metadata you retain before sharing real traces.
See trace retention for capture controls.
For a fixed task set, use the guided workflow to capture executions, review a recommendation, apply a change and verify it.
Start with analyze to see metrics, findings, and suggested changes together.
Findings link to the affected spans and describe the evidence and assumptions
behind each suggestion. A repeated tool name, for example, does not prove that
its calls are safe to run concurrently.
| Command | Purpose |
|---|---|
agentloop report runs/research_agent.json |
Inspect runtime, usage, costs, and call counts. |
agentloop diagnose --path runs/research_agent.json |
Inspect findings and their supporting spans. |
agentloop optimize --path runs/research_agent.json |
Review proposed optimizations and estimated savings. |
agentloop patch --path runs/research_agent.json --repo . |
Generate a repository patch plan for manual review. |
Optimization savings are predictions. Change one thing, record another run, and measure the result. See finding rules, parallelization evidence, and estimator provenance for how suggestions are derived.
To try the comparison workflow before instrumenting your application:
agentloop demo --kind proof
agentloop replay --baseline runs/agentloop_proof_baseline.json --candidate runs/agentloop_proof_candidate.json
This pair is synthetic and demonstrates the gates. Its result does not measure your application's performance.
Record your agent on a task and export runs/baseline.json. Make your change, run
the same task again, and export runs/candidate.json. Then compare the files:
agentloop replay --baseline runs/baseline.json --candidate runs/candidate.json --min-latency-improvement-pct 10This gate requires at least a 10% latency improvement. The report also compares
tokens, costs, retries, and call counts. It writes runs/replay_report.md and exits
nonzero when a required gate fails. replay evaluates saved evidence; your
application supplies both runs.
Use representative tasks and repeated runs before drawing broader conclusions. For experiments across tasks and conditions, see paired studies and the research guide. The intervention ledger links predictions to measured results.
A faster run still needs to meet its task requirements. For the local tracing
example, save this as fixtures.json:
{
  "fixtures": [
    {
      "id": "notes_present",
      "scorer": {"type": "required_fields", "required": ["notes"]}
    }
  ]
}
agentloop quality-report fixtures.json --candidate runs/research_agent.jsonThis checks that the recorded output has a nonempty notes field. Choose checks
that express correctness for your own task. Fixtures can supply outputs directly
or read metadata.output; the last model call's output text is another supported
source when captured.
Built-in scorers include exact_match, contains, bounded glob, required_fields,
and json_subset. Structured quality fixtures cover
classification, routing, extraction, and other decision outputs. A custom scorer
executes a trusted local Python function; the HTTP API rejects custom scorers.
See scorer migration notes for renamed checks.
Once you have both runs, use your fixtures in a CI gate:
agentloop ci --baseline runs/baseline.json --candidate runs/candidate.json --quality-fixtures fixtures.jsonEvery candidate case must pass. Optional --min-quality-score thresholds also
apply to the average score. Invalid fixture suites fail closed. ci writes a
Markdown report and exits nonzero when a required gate fails. See
CI setup for comparing your application's artifacts in pull requests.
| Result | Interpretation |
|---|---|
| Runtime | total_runtime_ms is elapsed time. cumulative_span_time_ms sums spans and can be larger when calls overlap or nest. |
| Tokens | Counts retain their source: provider, tokenizer, user code, or a word-count estimate. Missing usage is marked unavailable. |
| Model costs | Estimates use token counts and configured prices. Unknown prices or estimated usage limit cost comparisons. |
| Optimization savings | Uncalibrated predictions, with recorded formulas and assumptions. Confirm them with candidate runs. |
| Quality scores | Results of the checks you supplied; their coverage depends on your fixtures. |
Cost gates can be indeterminate when pricing or usable usage is missing. This
does not fail the default cost gate; a positive --min-cost-improvement-pct
requires verifiable improvement. See pricing and
trace compatibility.
Rule failures remain visible and mark analysis incomplete. CI requires complete analysis before recommending a merge. Keep your Markdown renderer's safe mode or HTML sanitizer enabled when viewing reports from untrusted traces.
Use separate filenames for source traces, quality fixtures, and each report format. The analysis and report commands reject paths that would replace source evidence or make outputs overwrite each other, including aliases through filesystem links. You can rerun a command to replace an existing report at its own output path.
replay, quality-report, and ci exit with code 1 when configured checks fail.
Invalid command arguments exit with code 2. analyze produces a report for
inspection, including failed comparison checks; use replay or ci to enforce a
gate. Run agentloop COMMAND --help to see its output options and thresholds.
| Source | Integration path |
|---|---|
| Custom Python agents and pipelines | Decorators, context managers, and workflow annotations. |
| OpenAI SDK | Wrap a client or callable to capture calls, streams, and reported usage. |
| OpenAI Agents SDK | Attach an AgentLoop tracing processor. |
| LangGraph | Instrument the builder before adding nodes, then wrap the compiled runnable. |
| CrewAI | Wrap crew, task, or agent execution methods. |
| OTLP, OpenInference, MCP, and Vercel AI telemetry | Import supported JSON telemetry into native traces. |
| Harbor and Omnigent | Import completed execution files with source receipts and explicit coverage gaps. |
Adapters are included in version 0.1.0. Install the framework's own SDK separately
when needed; python -m pip install "agentloop-profiler[instrumentation]" includes
the OpenAI Python SDK. Follow the integration guide for
setup, supported behavior, and streaming lifecycle requirements.
Hermes Agent tracing is included in AgentLoop 0.1.1 and newer.
Export its dependency-free directory plugin with agentloop hermes export-plugin,
enable it in your Hermes profile, and analyze the native turn traces it writes.
Output capture is off by default. AgentLoop 0.2.0 supports Hermes
>=0.21.6,<0.24, with 0.21.6 hook-contract coverage and pinned 0.22.7/0.23.1
host conformance across eight scenarios. Exact pins and validation commands
appear in the runtime pilot.
For telemetry you already export, onboarding validates capture before analysis. The interoperability guide covers Harbor ATIF/jobs, Omnigent sessions, bounded OTLP JSONL, offline capability probes, and cross-harness comparisons. These imports work without upstream runtimes or credentials. For classifiers and decision pipelines, start with AI execution profiling.
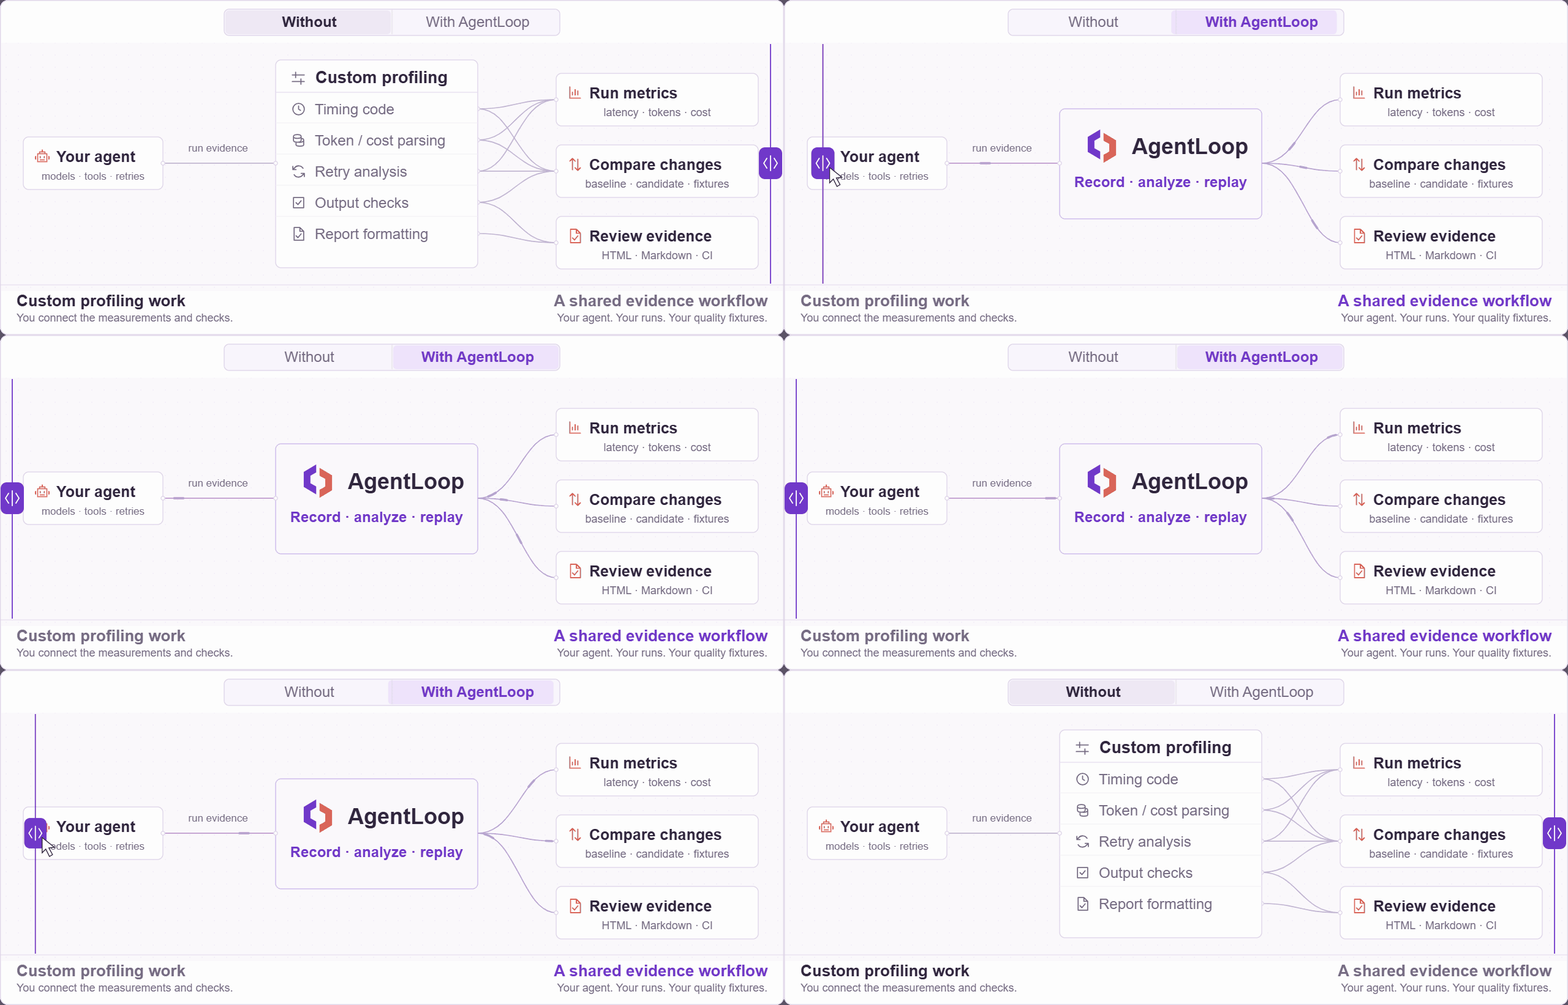
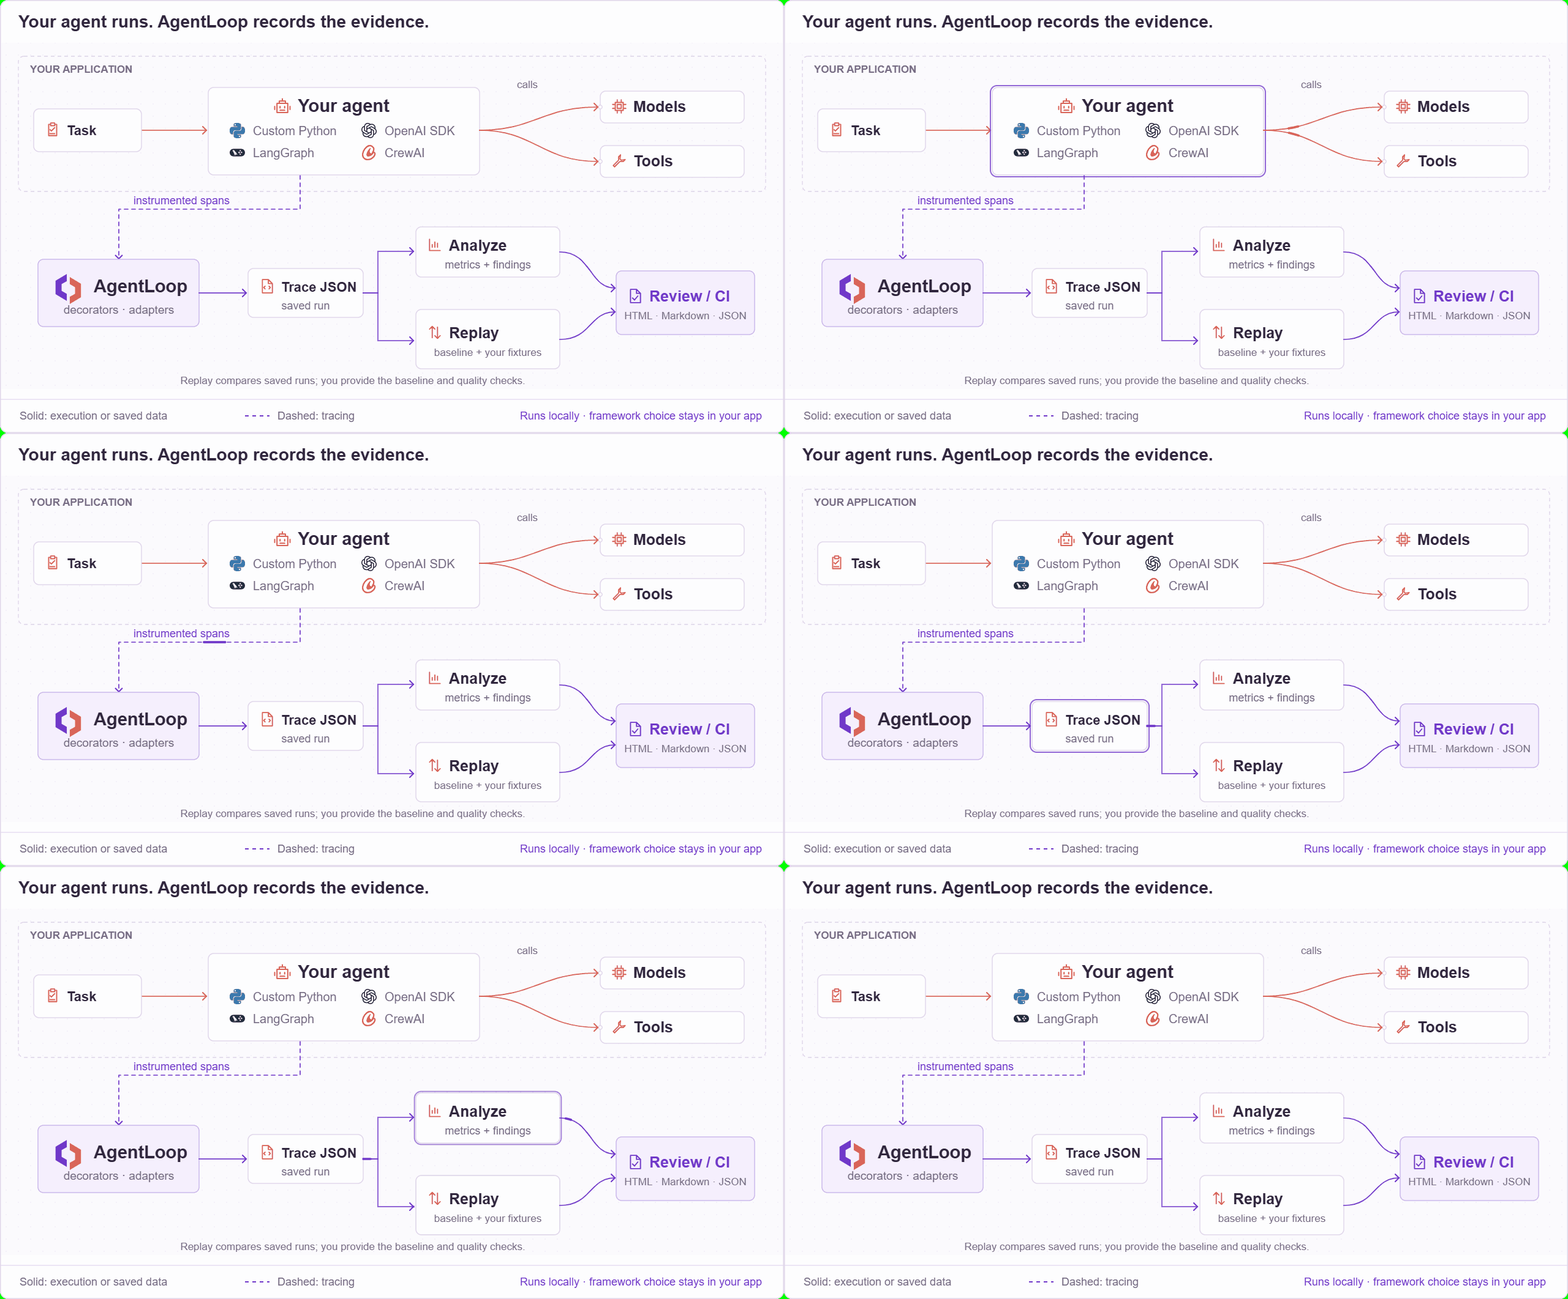
Your application runs the agent and chooses its framework and models. AgentLoop records instrumented calls, analyzes the resulting trace, and compares saved runs with your performance thresholds and quality fixtures. You choose and apply the code changes.
View the workflow diagrams
From a source checkout, load the synthetic example and start the dashboard:
uv run --frozen --all-extras agentloop quickstart
uv run --frozen --all-extras agentloop store-trace --path runs/agentloop_quickstart.json --project-id default
uv run --frozen --all-extras streamlit run dashboard/app.py
Open Streamlit's printed URL and leave the sidebar's Project field set to default.
Use store-trace to load your own files. Storage uses SQLite by default and also
supports Postgres. The optional HTTP API serves project-scoped traces and reports
through /v1 endpoints.
See dashboard setup, API versioning, and production deployment for configuration and authentication.
Use a checkout for the examples, dashboard source, or changes since the latest release. Install uv, then:
git clone https://github.com/dipeshbabu/agentloop.git
cd agentloop
uv sync --locked --all-extras
uv run --frozen --all-extras agentloop quickstartGitHub Releases provides
executables for Linux x86-64, Windows x86-64, macOS Intel, and macOS Apple silicon.
They bundle Python and the core CLI. Use the Python package for SDK instrumentation,
the dashboard, API server, or Postgres support. Substitute the downloaded executable
where the examples show agentloop.
Download and verify a standalone executable
Download the executable and SHA256SUMS from the same release. These examples use
version 0.2.0. Change the version when choosing another release.
Linux (Bash):
set -euo pipefail
version=0.2.0
asset="agentloop-v${version}-linux-x86_64"
curl --fail --location --remote-name "https://github.com/dipeshbabu/agentloop/releases/download/v${version}/${asset}"
curl --fail --location --remote-name "https://github.com/dipeshbabu/agentloop/releases/download/v${version}/SHA256SUMS"
mapfile -t checksum_lines < <(awk -v asset="$asset" '$2 == asset { print }' SHA256SUMS)
if [ "${#checksum_lines[@]}" -ne 1 ]; then
  echo "Expected exactly one checksum for ${asset}" >&2
  exit 1
fi
printf '%s\n' "${checksum_lines[0]}" | sha256sum --check --strict
chmod +x "$asset"
./"$asset" --help
Windows PowerShell:
$Version = "0.2.0"
$Asset = "agentloop-v$Version-windows-x86_64.exe"
Invoke-WebRequest "https://github.com/dipeshbabu/agentloop/releases/download/v$Version/$Asset" -OutFile agentloop.exe
Invoke-WebRequest "https://github.com/dipeshbabu/agentloop/releases/download/v$Version/SHA256SUMS" -OutFile SHA256SUMS
$ChecksumLines = @(Get-Content SHA256SUMS | Where-Object {
    $_ -match "^[0-9a-fA-F]{64}  $([regex]::Escape($Asset))$"
})
if ($ChecksumLines.Count -ne 1) { throw "Expected exactly one checksum for $Asset" }
$ExpectedHash = ($ChecksumLines[0] -split "  ", 2)[0]
$ActualHash = (Get-FileHash .\agentloop.exe -Algorithm SHA256).Hash
if ($ActualHash -ne $ExpectedHash) { throw "Checksum verification failed for $Asset" }
.\agentloop.exe --help
Each release includes platform-specific third-party notices. macOS executables are ad-hoc signed but not notarized; Gatekeeper may require approval on first launch.
Run agentloop --help for all commands, or agentloop COMMAND --help for one command.
The first-use guide walks through the analysis workflow.
- Support and issue forms: questions, bugs, and feature requests.
- Contributing: development setup and required checks.
- Changelog, upgrade guide, and roadmap: releases, compatibility, and planned work.
- Security: private vulnerability reports.
- Governance and Code of Conduct: project decisions and participation.
AgentLoop is under active pre-1.0 development. Pin a tagged release when you need a fixed version, and check the changelog before upgrading.
Copyright 2026 Dipesh Tharu Mahato.
AgentLoop is licensed under the Apache License 2.0. Dependencies retain their own terms; see https://github.com/dipeshbabu/agentloop/blob/main/THIRD_PARTY_LICENSES.md.