


Lay out an ER diagram (SQL DDL, DBML or JSON) with the fewest possible line crossings, and a proof. erlayout chooses the columns and the vertical order of every table jointly with an exact constraint solver (OR-Tools CP-SAT). It returns either a layout proven optimal or the best one found together with a proven lower bound.
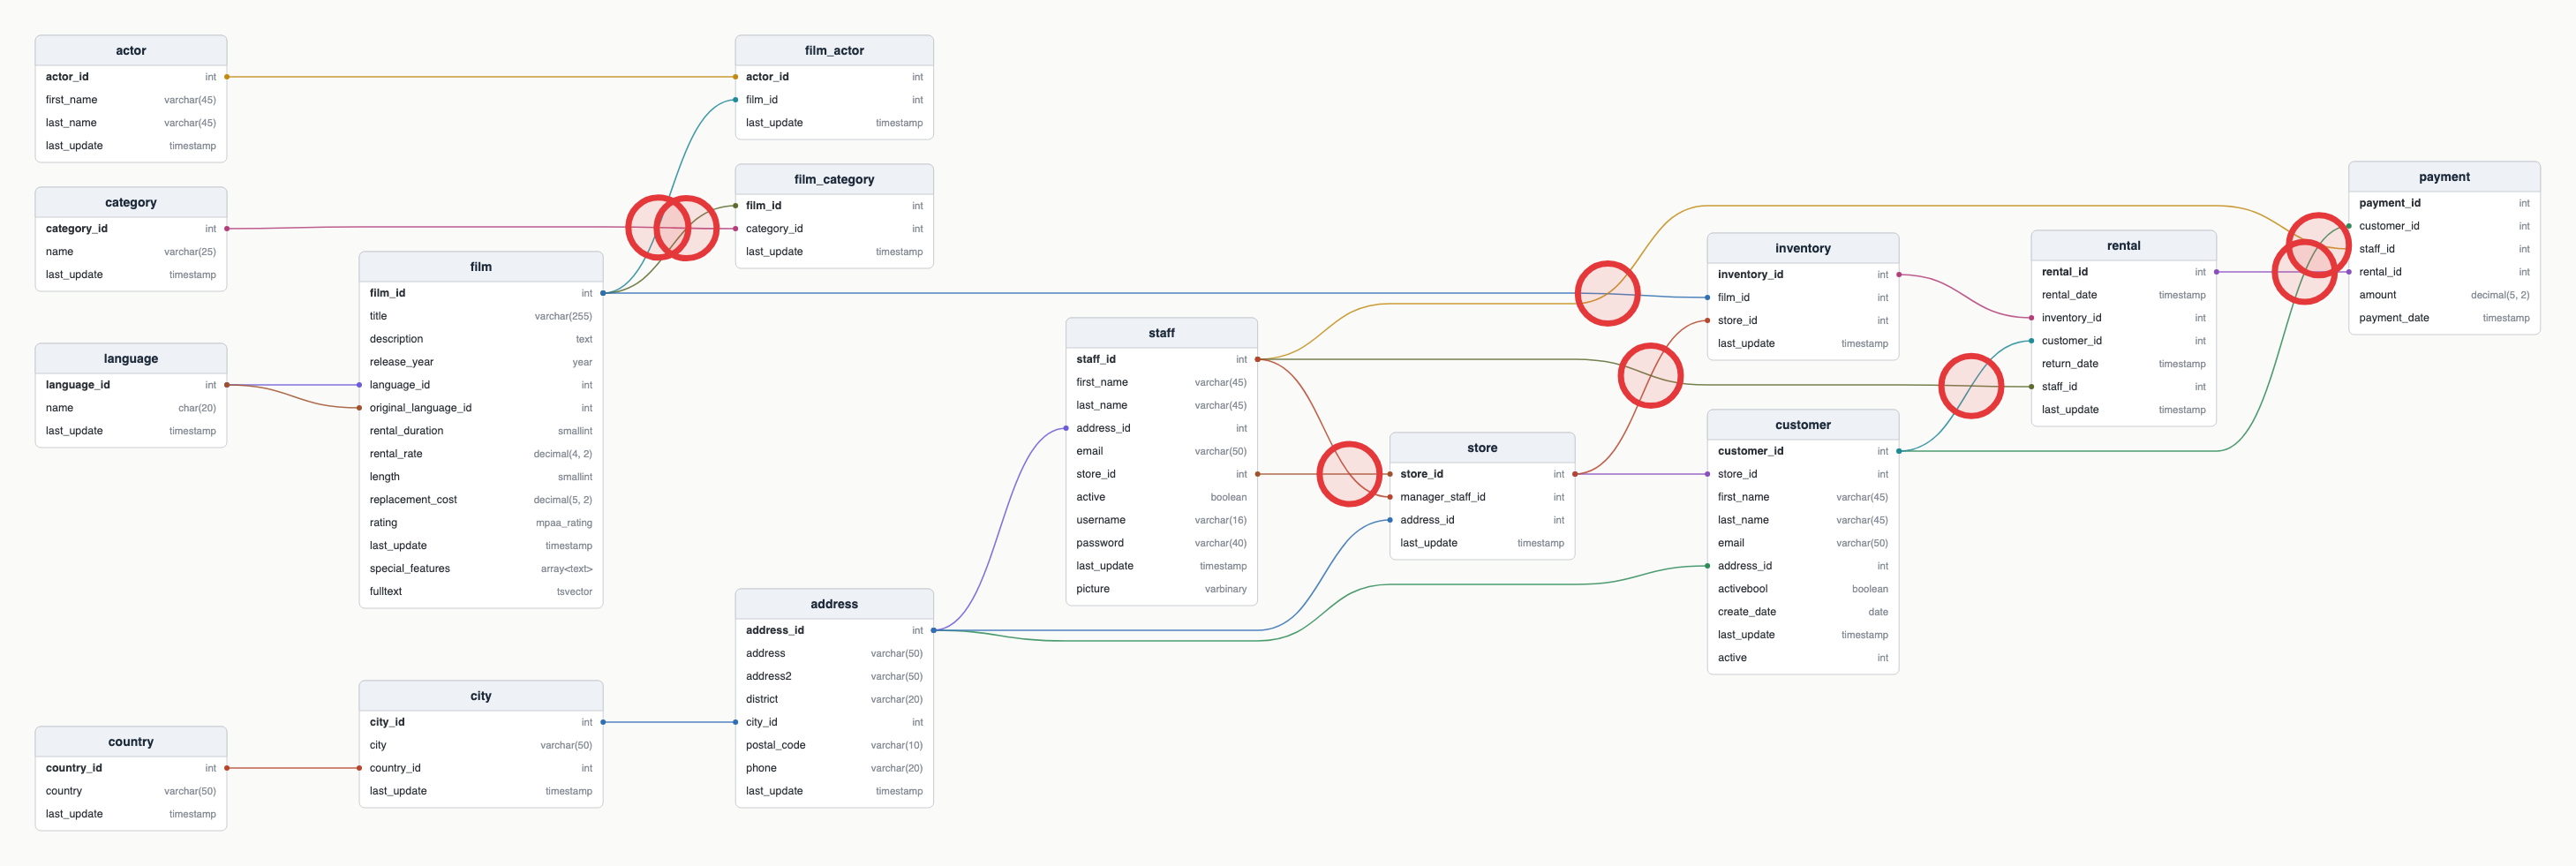
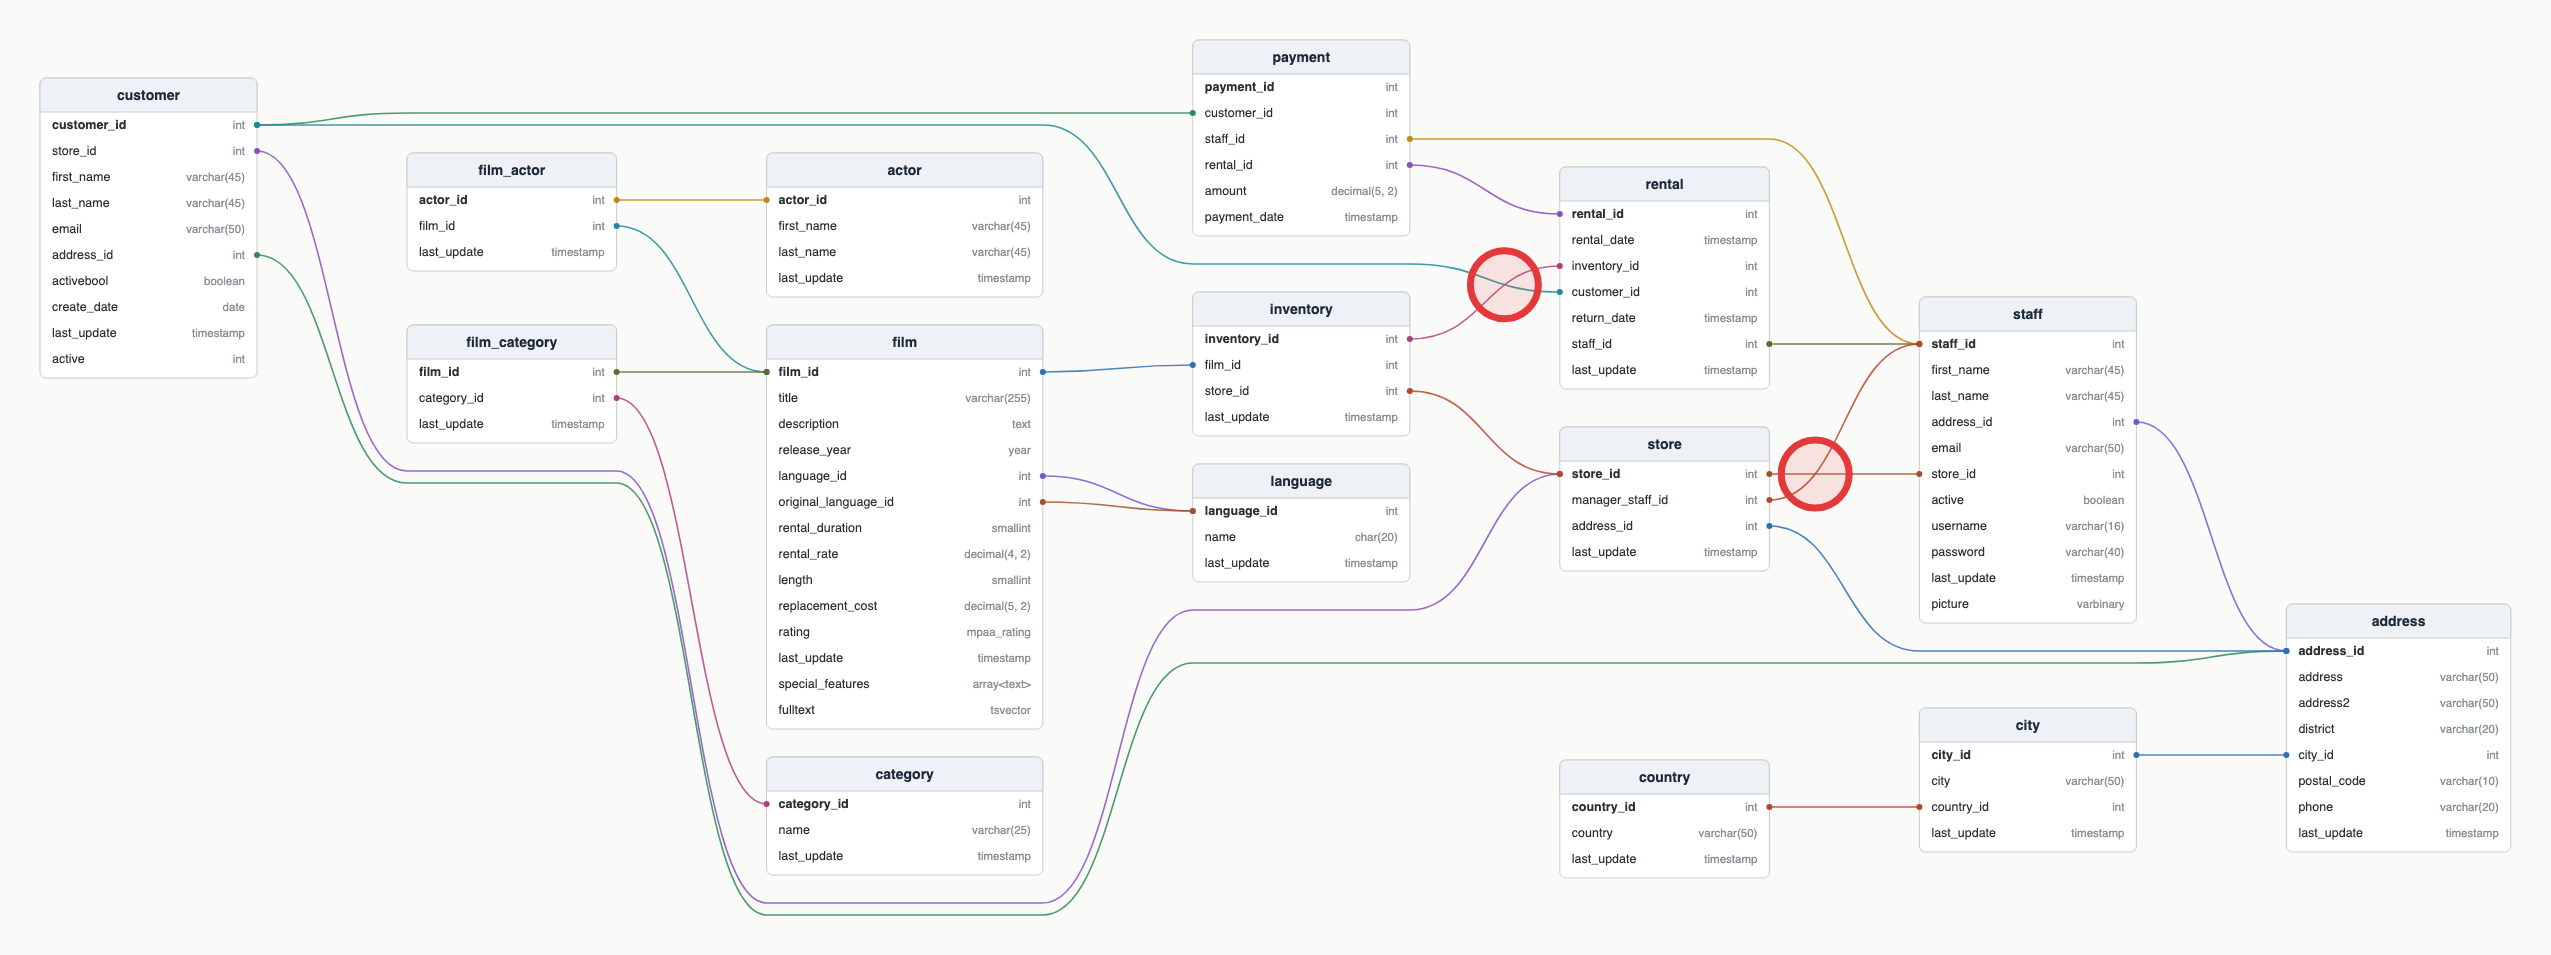
The Sakila sample database (15 tables, 22 foreign keys), drawn by the usual layered method and by erlayout, with every crossing circled in red. Click an image for full size.
| Standard layered layout (longest path + barycenter) |
erlayout, rows as declared | erlayout, rows reordered freely |
|---|---|---|
 |
 |
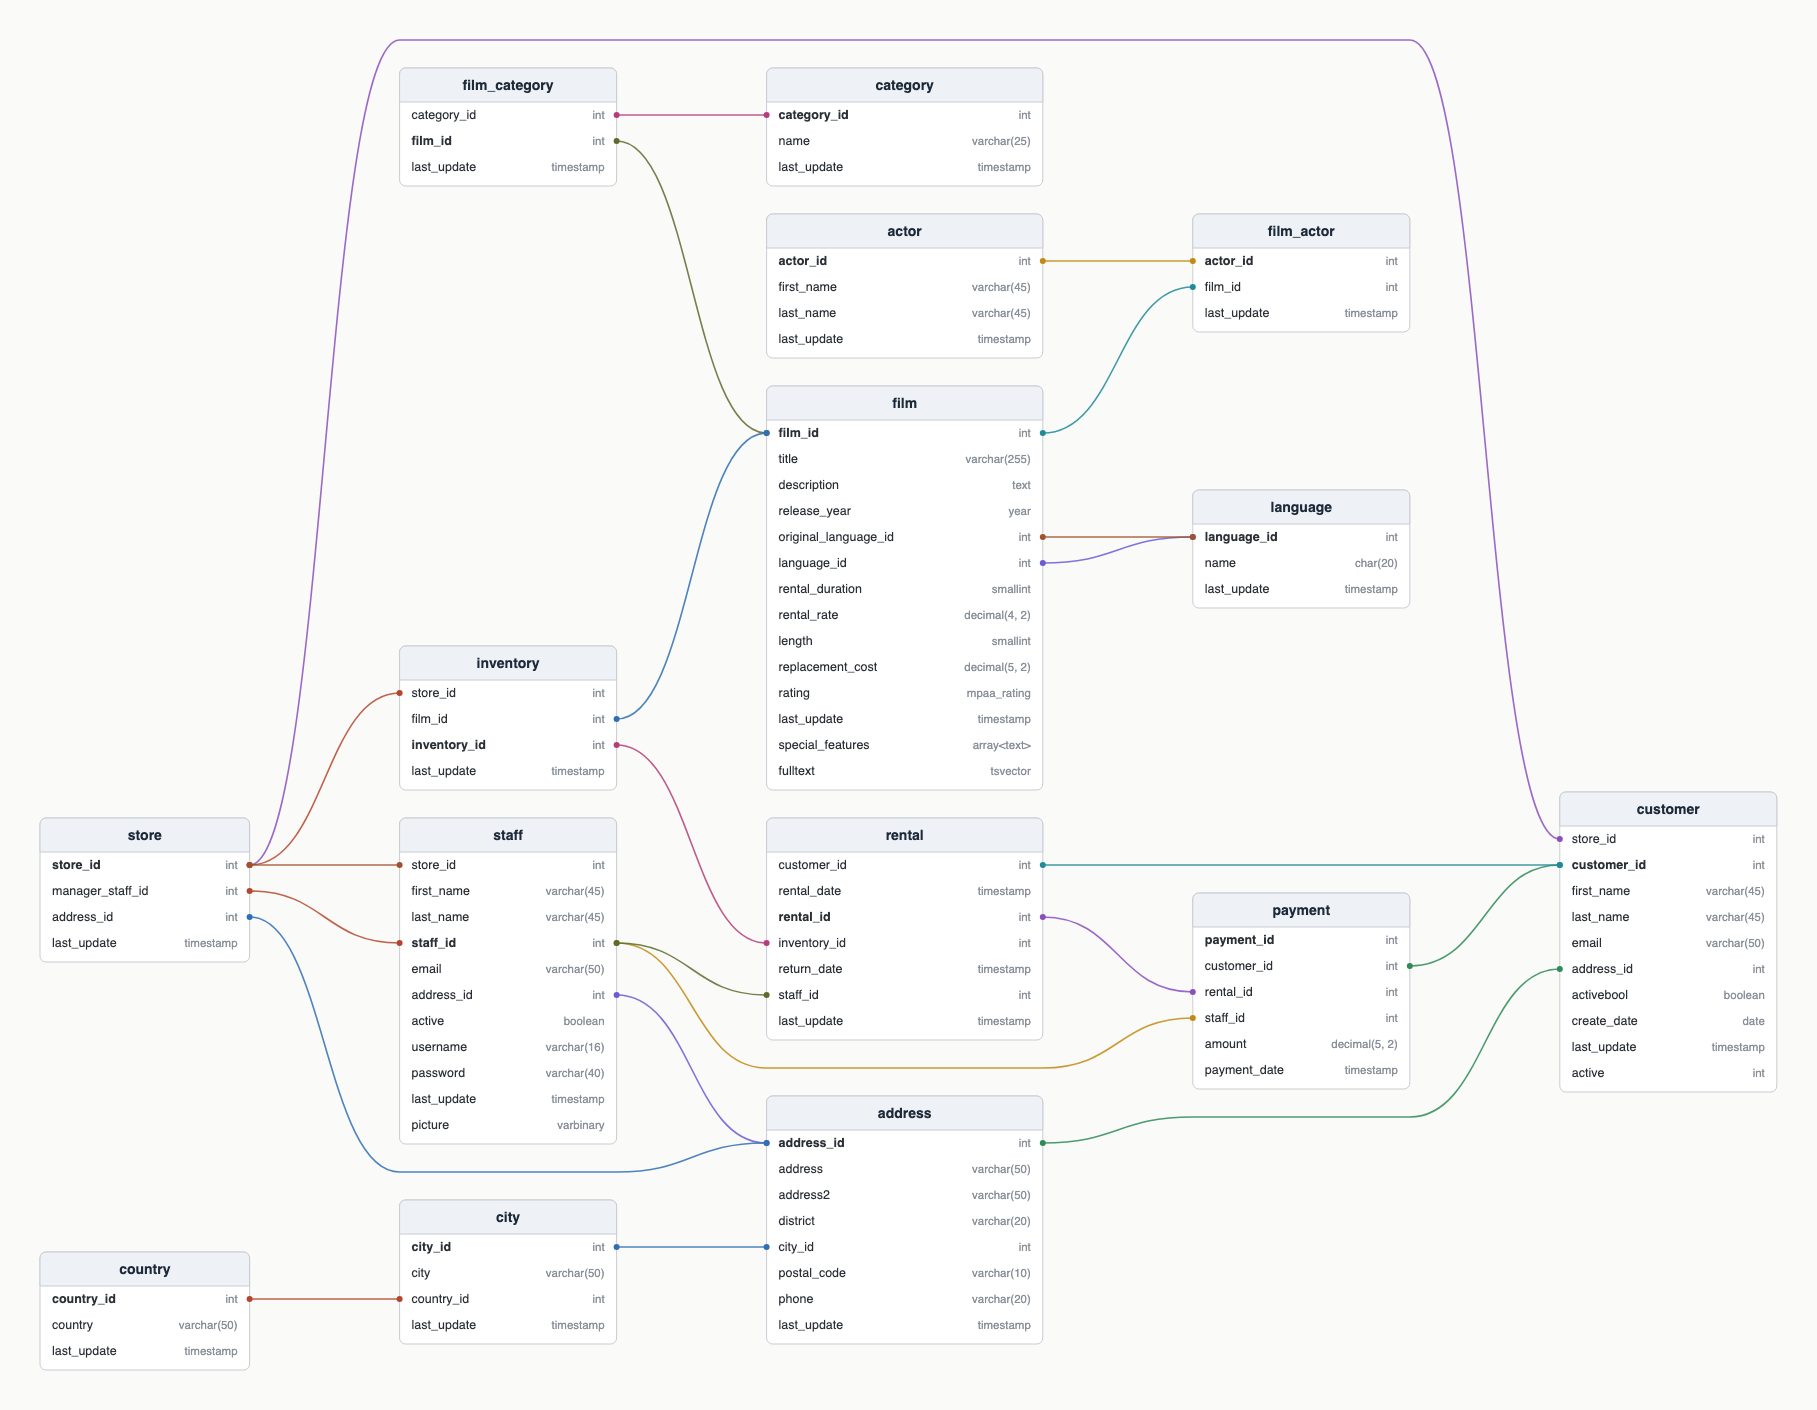 |
| 8 crossings | 2 crossings, proven minimum | 0 crossings |
The images are erlayout's own SVG output for examples/sakila.sql,
rendered to PNG by bench/readme_images.py, which places the red circles where
the geometric check finds crossings. Keeping the primary key on top while reordering gives 1
crossing, also proven minimal.
The result can be exported to draw.io, Excalidraw or Mermaid, so it can serve as a starting layout you keep editing. Coming from dbdiagram.io? See docs/dbdiagram.md.
Tables sit in columns; every foreign-key line attaches to its exact column row; long lines pass between tables. Within this layered model erlayout minimises crossings first, then total line length. Every result states which guarantee it carries:
| Guarantee | Meaning |
|---|---|
| Proven optimal: 0 crossings | Nothing can beat it. |
| Proven optimal over every layered drawing (certificate) | A small sub-schema that forces the same number of crossings in any drawing is listed with the result. |
| Proven optimal among drawings with at most K columns | Wider drawings were not ruled out. |
| Best found, lower bound L | The time budget ran out first. |
Every result is re-checked by two verifiers that share no code with the solver: a combinatorial recount and a geometric intersection test on the drawn curves.
pip install erlayout # Python 3.10+or, with pipx or uv, as a
command-line tool in its own environment: pipx install erlayout or
uv tool install erlayout.
From a checkout, for development:
python -m venv .venv && source .venv/bin/activate
pip install -e ".[test]"
uv.lock pins every dependency; uv sync --locked --extra test installs
exactly those versions (this is what CI and the Docker image use).
Use a fresh virtual environment rather than a conda base environment. In
Anaconda, OR-Tools imports pandas, pandas loads pyarrow, and pyarrow brings in
conda's own libprotobuf; OR-Tools then loads its bundled copy and the process
aborts with File already exists in database. If pip reports
ResolutionImpossible, install ortools on its own first, then the package.
erlayout layout schema.sql -o diagram.svg --time 300 --json result.json
erlayout layout schema.sql --k 5          # fix the number of columns
erlayout serve --port 8000                # web interface at http://127.0.0.1:8000
Options: --format sql|dbml|json (auto-detected), --k-max, --certify-time,
--workers (defaults to all cores).
The web interface has a Stop button while a layout is being searched, and
erlayout layout stops on Ctrl-C. Either way the search ends within about a
second and the best layout found so far is verified and kept, labelled
"stopped early". Nothing is claimed as proven unless the solver finished
that proof before the stop. Over HTTP: POST /api/jobs/{id}/stop.
-o can be given more than once, and its extension picks the format:
erlayout layout schema.dbml -o er.drawio -o er.excalidraw -o er.mmd -o er.svg- draw.io (
.drawio): tables as draw.io tables, links attached to their rows with crow's-foot ends, so they follow a table you drag. A split schema gets one page per group. - Excalidraw (
.excalidraw): tables grouped, links bound to them; a split schema gets one frame per group. - Mermaid (
.mmd): anerDiagramwith every table and relationship. Mermaid has no positions, so it lays the diagram out itself; only the declaration order comes from erlayout.
For a split schema, --each-group also writes every group to its own file.
In the web interface, Export as picks the format and Diagrams picks all
groups in one file, one group, or each group as its own file in a zip. The
same is available over HTTP as
GET /api/jobs/{id}/export/{svg|drawio|excalidraw|mermaid}?group={n|each}.
docker build -t erlayout .
docker run -p 8000:8000 erlayout          # or -e PORT=... to change the port
The image serves the web interface on $PORT and answers GET /health.
railway.json points Railway at the Dockerfile and that health check, so a
Railway service created from this repository deploys with no extra settings.
Environment variables for the web server:
| Variable | Meaning | Default (image) |
|---|---|---|
ERLAYOUT_MAX_RUNNING |
solves at once; further requests get HTTP 429 | 4 (2) |
ERLAYOUT_MAX_TIME |
longest time budget, in seconds, a request may use | 1800 (300) |
ERLAYOUT_WORKERS |
CP-SAT threads per solve | all cores (2) |
ERLAYOUT_LOG_LEVEL |
log verbosity | INFO |
Peak CPU use is about MAX_RUNNING × WORKERS cores; override these in Railway's
service variables to trade cost against speed.
By default every table keeps its columns in the order the schema declares.
--reorder-rows lets erlayout also choose the order of the rows that carry
foreign-key lines (other rows keep their places, the primary key stays on top);
add --free-pk to let the primary key move too. The web interface has the same
three choices under Row order. The new orders are listed in the output.
| Sakila, proven optimum | Crossings |
|---|---|
| Row order as declared | 2 |
| Reordered, primary key on top | 1 |
| Reordered freely | 0 |
A schema of hundreds of tables does not fit one readable drawing, and no
solver proves anything about it in reasonable time. Above 40 tables erlayout
therefore splits it (--split auto, the default; on and off force it):
- tables that reference each other a lot are grouped together, at most
--max-grouptables (default 15) per group, and each group is laid out and solved as its own diagram. The diagrams are placed in a grid shaped like a wide screen (--arrange grid, the default), side by side (row) or one above the other (column); - a link between two groups is not drawn: its row shows
→ orders (group 3)in place of the column type; - tables with no drawn link go into one compact panel at the end.
--hide-hubs auto (or a list such as --hide-hubs users,stores) also takes
the tables that most others point to out of the groups. Their links become
row tags (→ stores (hidden hub)), which removes the fans of lines such a
table draws. auto picks tables referenced by at least 10 foreign keys and
by at least 5% of all of them. The web interface has the same choices under
Options: Split, Group size, Arrange and Hide hub links. Crossing counts and proofs
are then per diagram; the summary says how many diagrams were proven optimal.
The search is anytime: a usable diagram is written to -o within about a
second (the heuristic baseline), and the file is rewritten every time a better
layout is found, so you can stop it whenever the result is good enough.
- Main run: one long fresh solve at a wide width (the larger of the baseline's width and a third of the table count).
- Certificate: if that width was proven optimal, a small sub-schema proof often certifies global optimality in seconds.
- Wider: a fresh solve two columns wider.
- Lower bound: sub-schema proofs, each capped so one hard proof cannot use up the budget; the result says how many crossings are unavoidable.
- Compact: narrower widths with the same number of crossings.
The web interface runs the same search as a background job and redraws the diagram as better layouts arrive.
| Schema | Tables / FKs | Baseline crossings | erlayout | Guarantee |
|---|---|---|---|---|
| Chinook | 11 / 10 | 1 | 0 | proven optimal |
| Northwind | 14 / 12 | 4 | 0 | proven optimal |
| Sakila | 15 / 22 | 8 | 2 | globally optimal, 6-table certificate |
The schemas are in examples/. The baseline is the classic Sugiyama
pipeline (longest-path layering and barycenter sweeps) in the same drawing
model. python bench/run_bench.py named 300 chinook northwind sakila
reruns these.
| File | Role |
|---|---|
erlayout/parse.py |
SQL (via sqlglot), DBML and JSON input |
erlayout/solver.py |
exact CP-SAT model and two-phase solve |
erlayout/certify.py |
sub-schema certificates of global optimality |
erlayout/heuristic.py |
barycenter baseline and warm start |
erlayout/crossings.py |
independent crossing recount |
erlayout/bruteforce.py |
exhaustive optimiser for tests |
erlayout/geometry.py |
coordinate LP and geometric verifier |
erlayout/render.py |
SVG output |
erlayout/split.py |
grouping of large schemas, hub detection, row tags |
erlayout/export.py |
draw.io, Excalidraw and Mermaid export |
erlayout/api.py, cli.py, web.py, static/ |
entry points |
bench/ |
benchmark, certificate search, README image and web interface check scripts; bench/out/results.jsonl holds every benchmark run |
docs/solver.md explains the drawing model, the CP-SAT encoding and how each guarantee is proven.
pytestThe suite compares the solver with exhaustive enumeration on random small schemas, checks certificates against brute force, checks geometry against the model, and exercises the parsers, CLI and web API.
Optimality is relative to the layered model above (curves between columns, no foreign key inside one column, lines leave tables on the side facing their target). Exact solving is practical up to a few dozen tables. For larger schemas erlayout estimates how long each exact model would take to build and skips the ones that do not fit the time budget; a schema of several hundred tables gets the barycenter layout within seconds, labelled as such, when splitting is turned off. Splitting gives up the single-drawing guarantee: each diagram is optimal on its own, and the links between diagrams are tags.
Bug reports, schemas that lay out badly and pull requests are welcome. See CONTRIBUTING.md for how to set up, test and pick a first issue.