Repository navigation
iPhone: the finger owns the chart, and the price chart on it (WP3) - #38
Conversation


The price chart now draws in one Canvas that never sees the finger, with
a small overlay that alone redraws under it. A fast sweep past both
edges keeps its marker, a slot change costs one overlay draw, and the
surface draws once a minute.

- FTWCharts: ChartSurface, ScrubOverlay (one finger scrubs, two hold a
  span), ScrubModel, and PriceBars: a bar per slot in ink by thirds,
  the now slot in full ink, the average as a dotted rule with its figure
  in the gutter, the cheapest two hours bracketed and named, tomorrow's
  slots as hatched stubs. The widget draws the same shapes as still
  paths; PriceLineChart and Swift Charts leave the price chart.
- The price view: a 60 pt hero that gives way to the slot under the
  finger, the chart, and two reserved lines for what the plan does then.
- Engine, from the chart research: DisplayBucket.minWidth 6 (Today 30
  min, 48 h 60 min), ChartSeries.band and a domain that fits the band's
  edges, ChartPath.reversed, LiveSeries (one point per reading, a
  Gaussian 2.5 pt wide with a raw head, a 2 s band on the clock), a
  scale floor per node, and PriceChart.
- CADisableMinimumFrameDurationOnPhone, so a chart may move above 60 Hz.
- A test holds round joins on every stroke in FTWCharts.
- The demo prices in quarter hours, as the Nordic market does.
- Debug only: -FTWFrameLog logs late frames and chart draws each second,
  and -FTWAutoScrub drives the overlay, for the simulator, where
  Instruments' hitch tools do not run.

Co-Authored-By: Claude Opus 5.5 <noreply@anthropic.com>

Codex Review SummaryThis comment shows the latest Codex review activity on this pull request.
ℹ️ About Codex in GitHubYour team has set up Codex to review pull requests in this repo. Reviews are triggered when you
Codex reacts with 👀 while any review is running, comments if it has suggestions, and reacts with 👍 once all reviews finish with no findings. |
![chatgpt-codex-connector[bot]](https://avatars.githubusercontent.com/in/1144995?s=60&v=4)

There was a problem hiding this comment.
💡 Codex Review
Here are some automated review suggestions for this pull request.
Reviewed commit: cbe601abc9
ℹ️ About Codex in GitHub
Your team has set up Codex to review pull requests in this repo. Reviews are triggered when you
- Open a pull request for review
- Mark a draft as ready
- Comment "@codex review".
If Codex has suggestions, it will comment; otherwise it will react with 👍.
Codex can also answer questions or update the PR. Try commenting "@codex address that feedback".
|
|
||
| var body: some View { | ||
| // Built once per minute or change of prices or plan. | ||
| let chart = PriceChart.build(window.slots, currency: window.currency, nowMs: minuteMs, plan: plan, clock: ZoneClock.of(.current)) |
There was a problem hiding this comment.

When the phone is outside the home's time zone, constructing the chart with .current shifts every axis, scrub, and cheapest-window label to the phone's clock and also evaluates the TOMORROW ~13:00 state against the wrong local time. The price cache already preserves the box zone in PriceEntry.timeZone, and the widget passes that zone into PriceChart.build; thread the same household zone through the in-app price view.
Useful? React with 👍 / 👎.
| let priced = spanMean != nil || (i.map { chart.minor[$0] != nil } ?? false) | ||
| let figure = spanMean.map(chart.figure) ?? i.map { chart.figure[$0] } ?? "—" | ||
| let word = scrub.span.map(chart.when) ?? scrub.index.map { chart.when[$0] } ?? (zone.isEmpty ? L("Now") : NodeWords.format("Now · %@", zone)) |
There was a problem hiding this comment.
If the chart changes granularity while a finger is down—for example, the supported mixed quarter-hour/hour window crosses into its hourly-only portion—the new grid shrinks from 96 slots to 24 while ScrubModel.index retains the old value. These unchecked subscripts (and the corresponding chart.doing[i] read below) then trap for an index above the new count; reset or clamp the selection whenever the rebuilt track no longer contains it.
Useful? React with 👍 / 👎.
Fredrik on 0.3.2: the price scrub should colour the whole 15-minute slot
the finger is on, not just a line. The overlay now dims the rest of the
plot under the ground at half strength, washes the slot's column from
top to bottom and draws its bar again in full ink, its whole width and
height. Two fingers light every bar between them. The rule stays as a
hairline. The debug frame log counts slot changes beside overlay draws.

Co-Authored-By: Claude Opus 5.5 <noreply@anthropic.com>

1 participant

WP3 of the iPhone polish release (Phosphor): the finger owns the chart. The price chart is the first chart on the new engine, and the engine gains what the chart research asks for, so WP6 (live) and WP7 (history) can build on it.
What changes
The price view. A 60 pt hero gives the price now, and under a finger the price and time of the slot it is on. Below it, the next 24 hours as a bar per slot:
AVGand its figure in the right gutter;CHEAPEST 11:00–13:00 · 51,9 ÖREunder the bracket;TOMORROW ~13:00until they are published;No cards. The chart is 240 pt on an SE and grows to 340 pt on a tall phone.
The slot under the finger lights up (Fredrik on 0.3.2: "It should clearly colour the whole 15-minute slot you are on, not just a line."). The overlay dims the rest of the plot under the ground at half strength, washes the slot's column from top to bottom, and draws its bar again in full ink, its whole width and height. Two fingers light every bar between them. The rule stays as a hairline.
The finger.
ChartSurfaceis one Canvas that never sees the finger.ScrubOverlayis a small Canvas on top that owns the gesture over the whole frame and reads onlyScrubModel, so a touch redraws the overlay and the hero and nothing else. The slot is a clamped index that never animates. One finger scrubs; two hold a span with its mean..selectionper slot crossed, at most one per 40 ms; a light impact at now, the cheapest window's edges, both ends, and each whole hour when the slots are quarters.The engine (
FTWShared/Charts, all tested):DisplayBucket.minWidth2.5 → 6: Today becomes 30-minute slots, 48 h 60-minute slots.ChartSeries.band: the slot's lowest to highest five-minute mean, two Steffen edges closed into one shape. The domain now fits the band's edges, not just the means.ChartPath.reversed()andaddBand(highs:lows:).LiveSeries: one point per reading, not per frame; a Gaussian 2.5 pt wide in screen space whose reach shrinks to zero at the head; Steffen; a raw min–max band in 2 s frames on the clock; a 6 pt head inset. WP6 draws it.EnergyNode.scaleFloorW(rating:): home 2 kW, grid 3 kW, battery 3 kW, solar 3 kW, car 3.7 kW, or the device's rating when known.PriceChart: the price chart's geometry and readouts, for the app and the widget.Also:
CADisableMinimumFrameDurationOnPhoneinFTW-Info.plist, so a chart may move above 60 Hz on ProMotion.ChartStrokeTestsfails on any stroke inFTWChartsthat does not join round.PriceLineChartand Swift Charts leave the price chart.CLAUDE.md: charts draw on the engine.-FTWFrameLog YESlogs late frames and chart draws each second;-FTWAutoScrub YESdrives the overlay through the path a touch takes.PriceScrubTour(UI test, skipped unless asked) drives real synthetic touches.Evidence
Tests.
swift test: FTWShared 146, FTWKit 293, all green. NowFitsTests 8/8 on an SE (3rd gen), iOS 26.5.New tests hold: every slot mean inside its band and every band edge inside the domain; a hole never counts as 0 in a band; the live head is the last raw reading and the line ends on it; the live line never leaves the readings within 3σ of it; the band does not change when the window moves 0.3 s; a silence is never bridged; one reading per value, a steady value flat; the price grid, thirds, hatched slots, hour labels, negative prices in words and the cheapest window; a finger past either edge or over a hole always has a slot; every stroke joins round.
Calm, on the research's synthetic live trace (a 2 kW heater 40 s on, 50 s off, meter noise ±25 W, 5 min at 1 Hz, 350 × 280 pt, 1.7 true edges per 100 pt):
LiveSeriesThresholds on recorded traces from the home box come with WP7.
The marker never lost.
PriceScrubTour.testFastSweepPastBothEdgeson a 17 Pro Max simulator: a fast sweep from the left edge to past the right, held; back past the left, held; then a slow drag. The scrub log reads3 5 8 … 93 95 | 95 92 … 1 0 | 51 52 … 61(| = lifted): 60 slot changes, no nil while touching, no "touching with no slot". 18 ticks and 13 impacts for those 60 changes.Frames: simulator, not a device. Instruments refuses Animation Hitches in the simulator ("Hitches is not supported on this platform"), and
XCTHitchMetricrecords nothing there. So I measured with the debug frame log while-FTWAutoScrubswept the chart back and forth past both edges for 10 s, about 50 slot changes a second:An earlier run under a load average of 130 to 250 from other sessions' simulators gave 0 ms/s in 7 of 10 seconds and 6 ms/s on average; an idle price view under that load showed the same spikes. The simulator cannot stand in for the device. Fredrik's iPhone is paired with this Mac; I did not install a debug build on it, since that would replace the TestFlight app. A run there with Instruments (Animation Hitches, 10 s scrub) is the remaining proof.
Screenshots
From the demo, dark, light and the largest text, SE (3rd gen) and 17 Pro Max, idle and under a finger (one finger, two fingers).
SE, with the lit slot: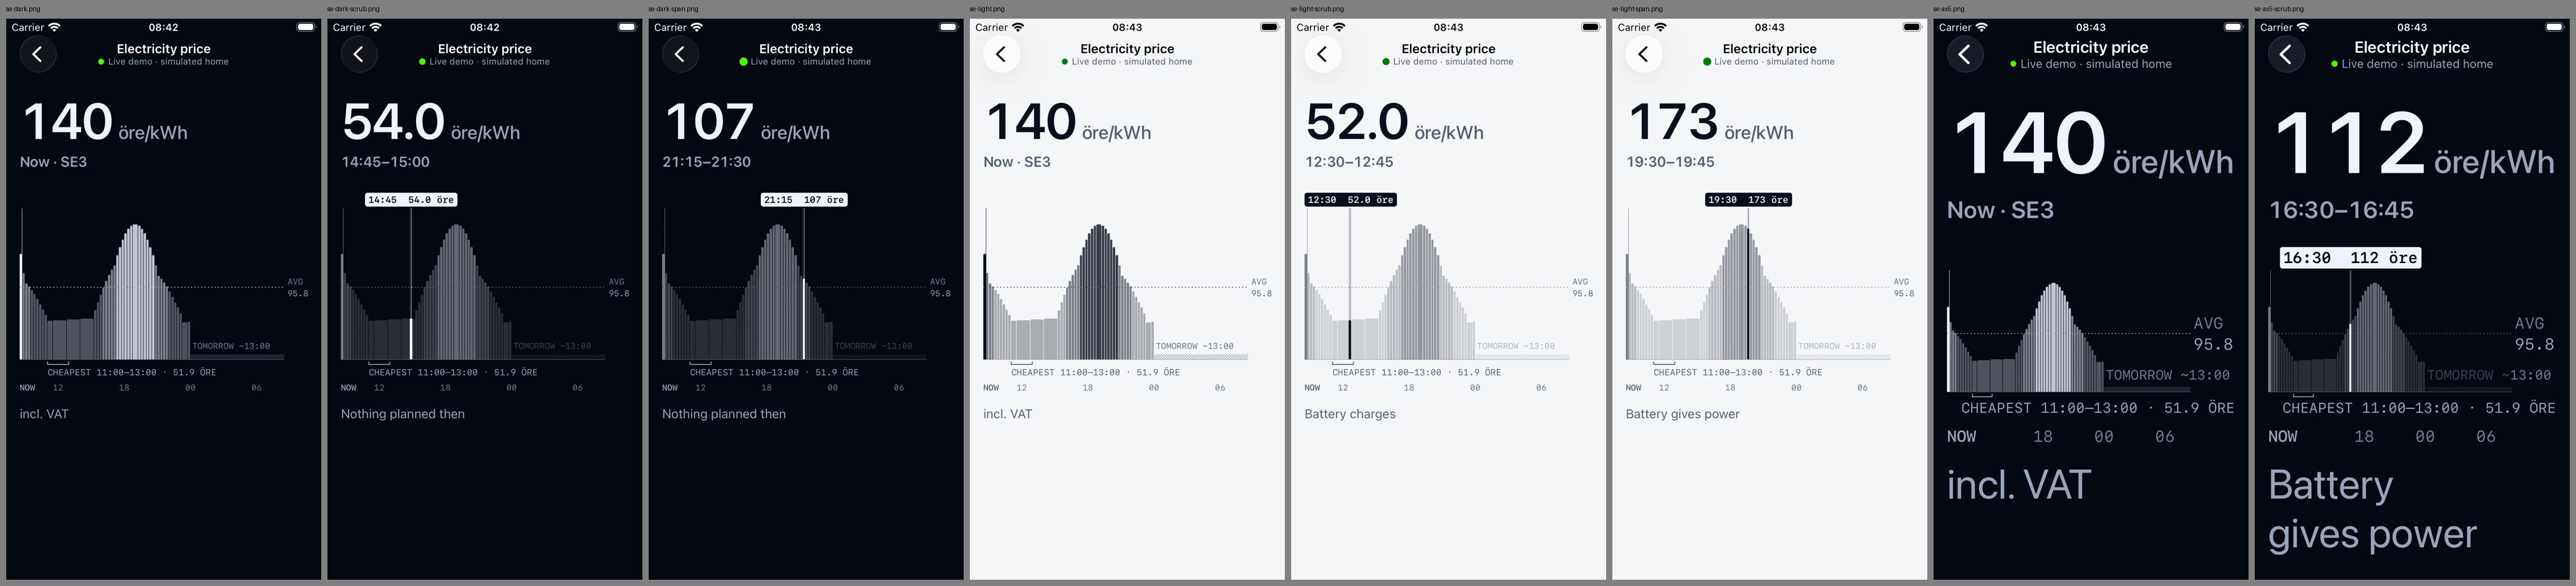
Pro Max, with the lit slot: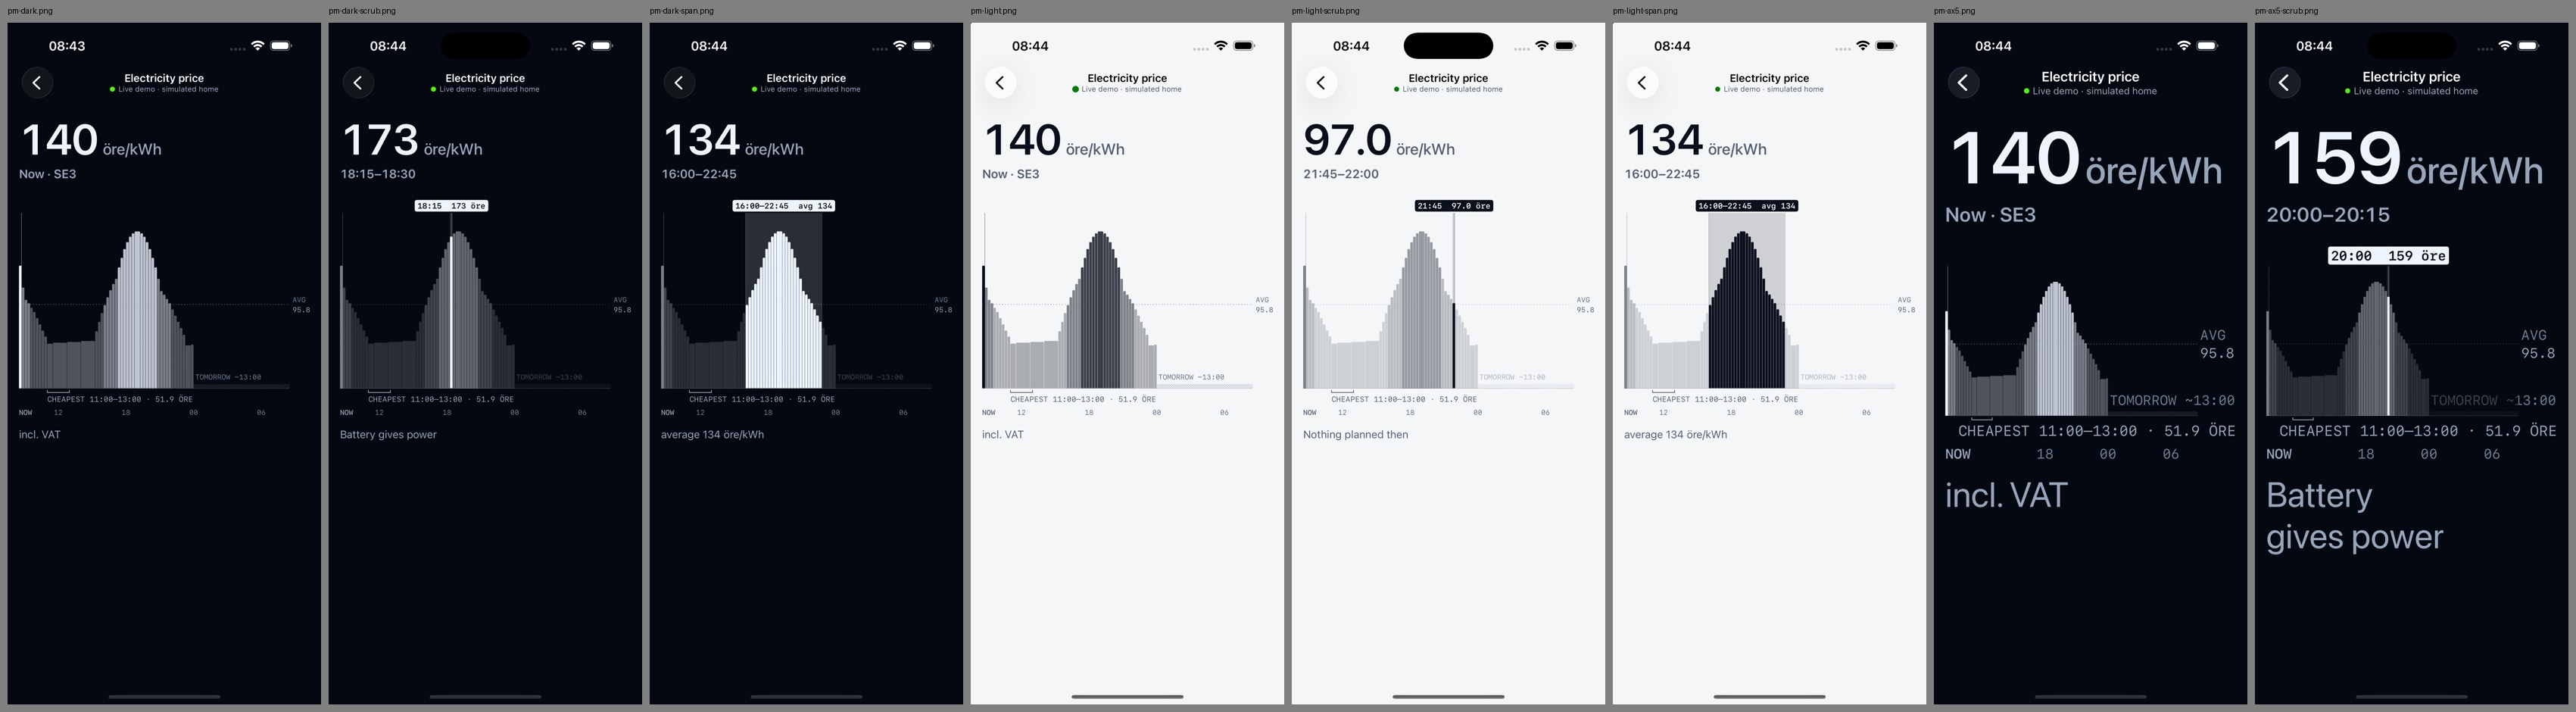
One finger and two fingers, Pro Max, dark: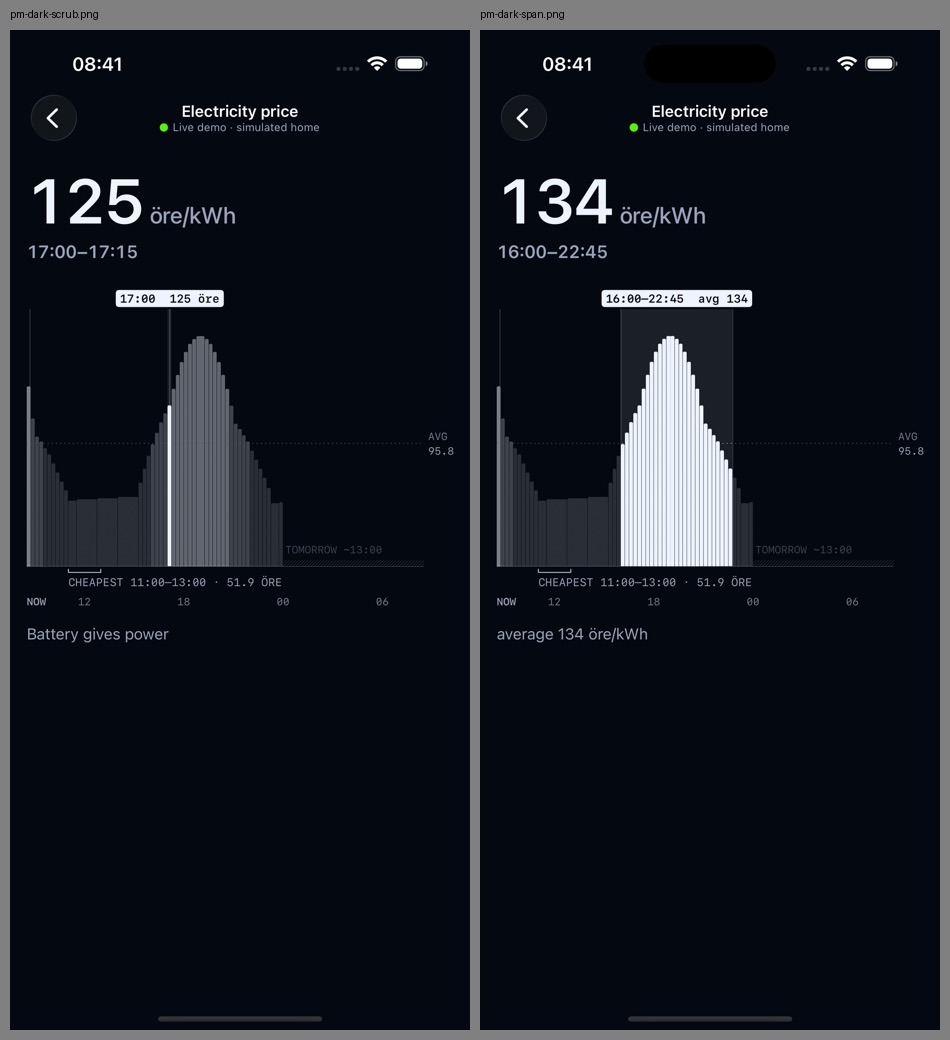
Before the lit slot (same build otherwise): SE, Pro Max.
The widget, drawing the same bars as still shapes: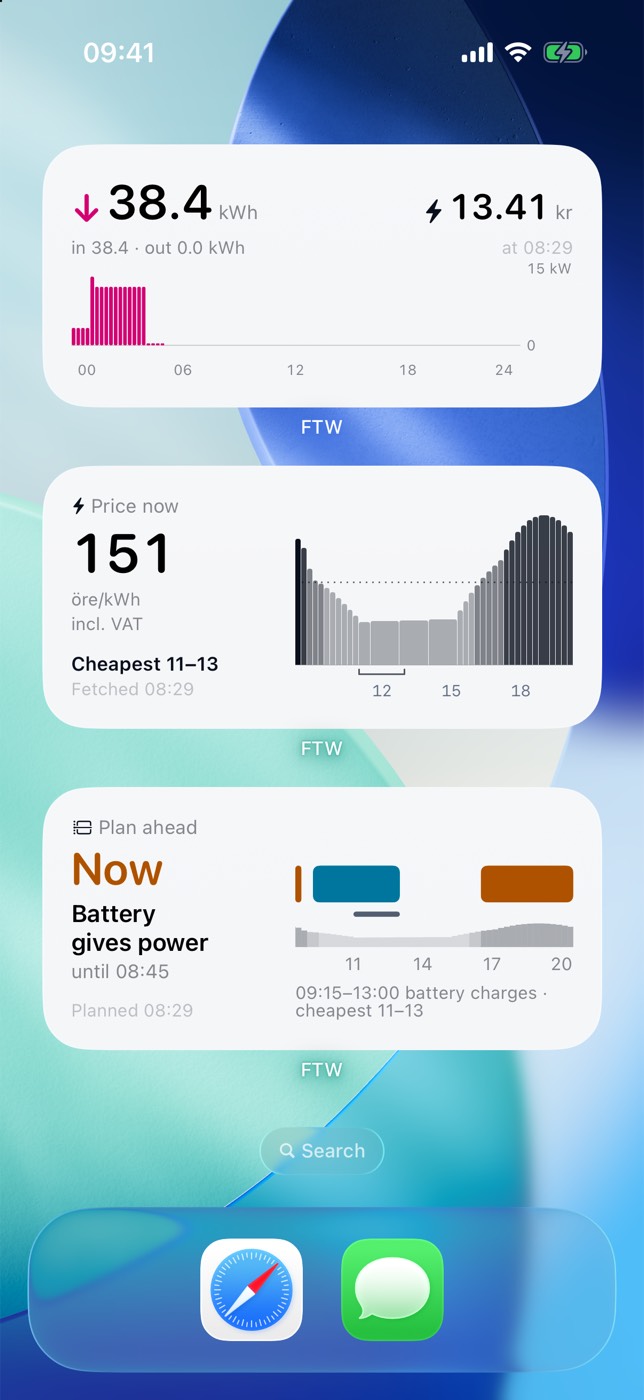
Single shots are in the shots branch.
Recordings
Recorded before the lit slot:
Departures from the design document
ScrubModellives inFTWCharts, notFTW/UI: the overlay reads it, andFTWChartsbuilds into the widget too.SpatialEventGesture(every touch at once) in place ofDragGesture, so two fingers keep the span the old Swift Charts price chart had.Overlap
#27 (plan dial, paused draft) touches
ChartWords.swiftandNodeWords.swift. This PR removesReadouts.price(_:currency:plan:at:)andReadouts.price(_:currency:range:), which only the old price chart used, and adds two Swedish words. WP11 reworks #27 and will meet these.🤖 Generated with Claude Code