Repository navigation
Tutorials Topic Modeling
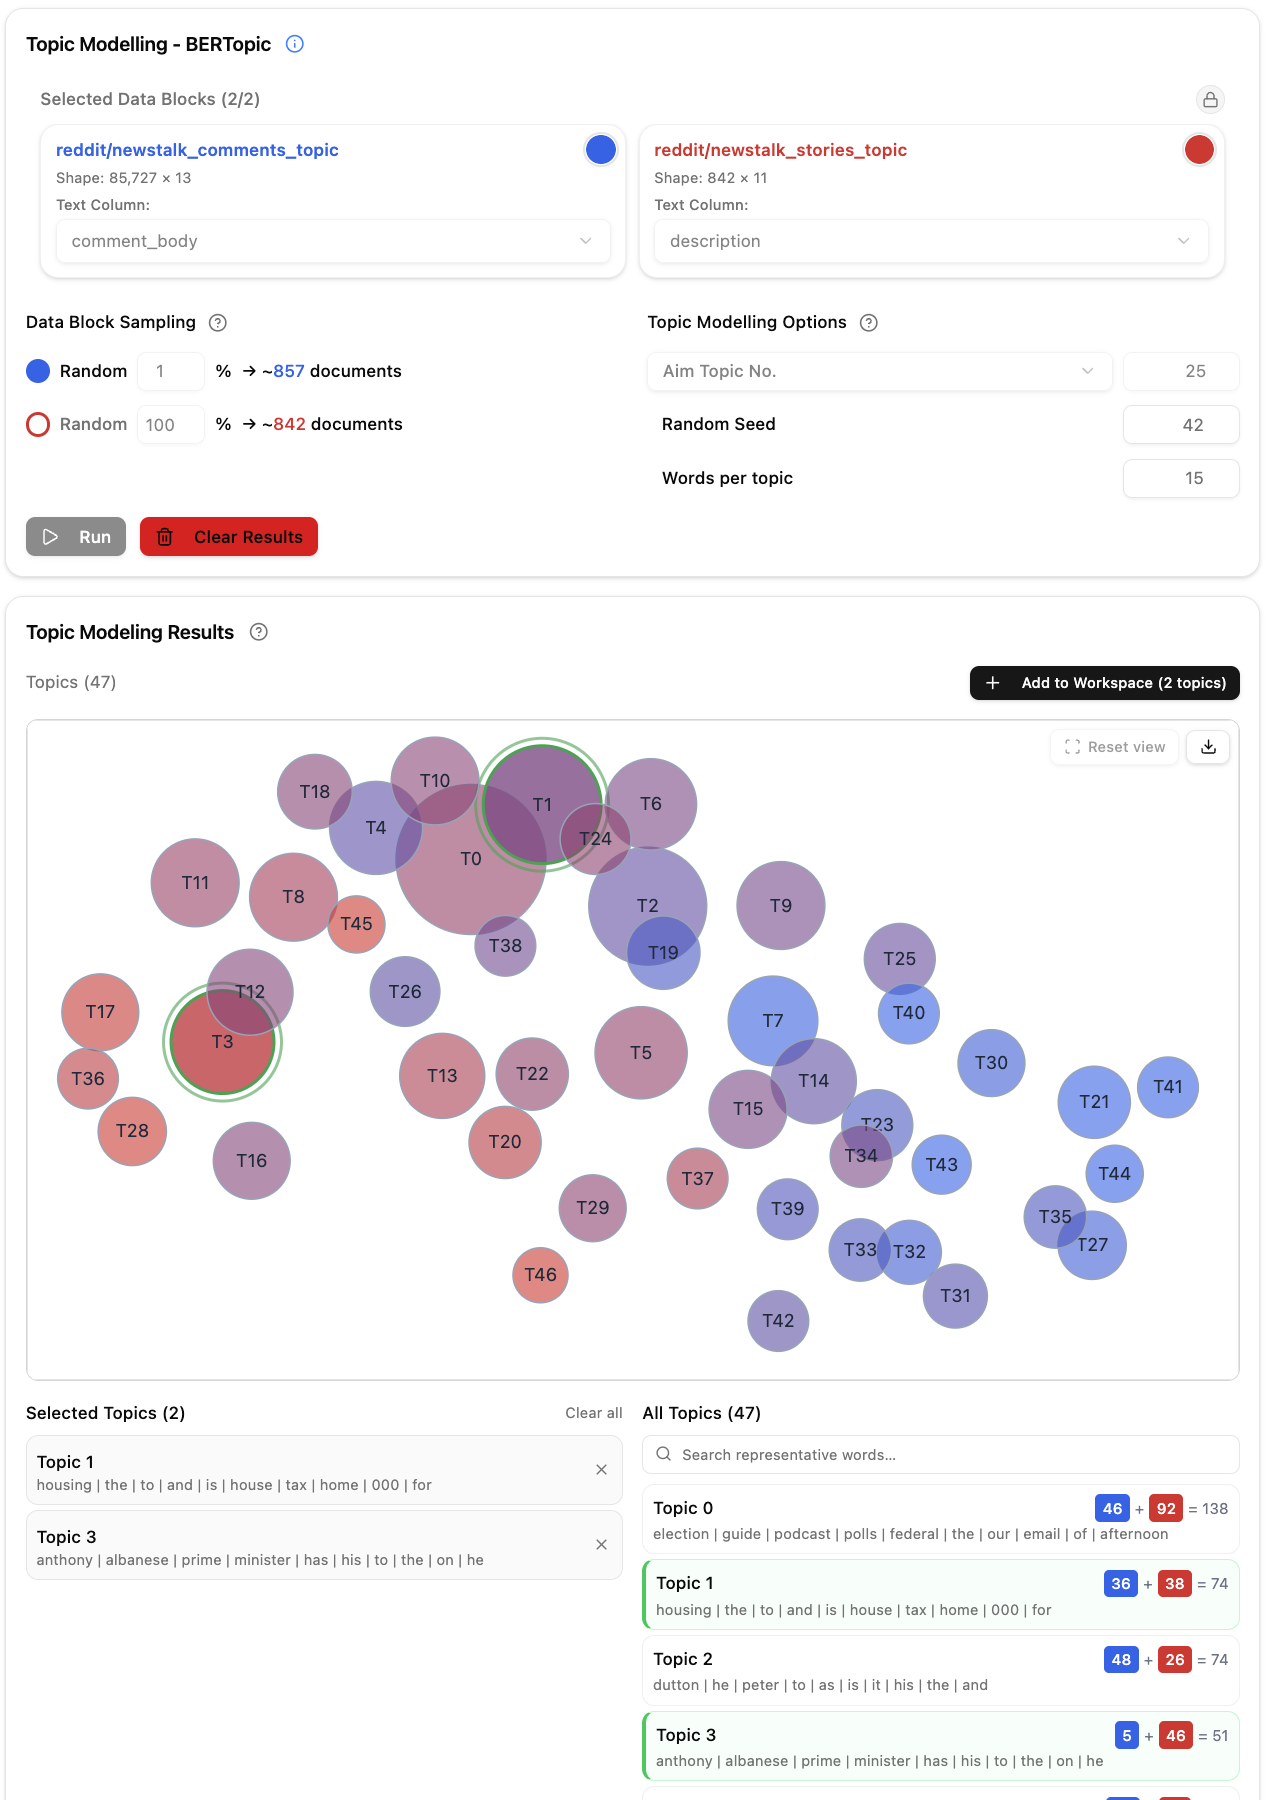
Topic modelling discovers recurring themes in a collection. Wordflow divides each document into Topic Segments, embeds those segments, groups similar segments, and rolls their topic assignments back up to each source document.
Choose one or two Data Blocks and select the text column for each. A run on two Data Blocks fits one shared model and shows how each topic is distributed between the two corpora.
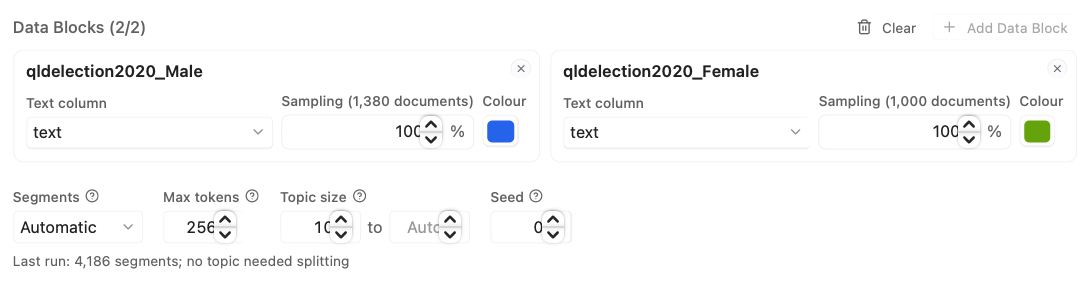
Each Data Block has an independent sampling percentage. The default is 100%. Lower sampling makes exploratory runs faster but can hide rare themes or make small topics less stable. For a very large corpus, Topic sampling shortens clustering and keeps every document in the result. When the selected text is long (over about 5 million tokens), a note under the Data Blocks gives a rough first-run time: reading the text into the model takes most of a first run, and later runs on the same text reuse that work. The label reports the effective document count, for example Sampling (1,380 documents). The sample uses the Seed setting, so the same Seed and percentage always pick the same documents, whichever order the Data Blocks are in. The Colour square sets the Data Block's colour in the bubble chart and topic lists.
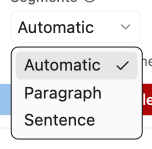
This setting controls which spans become Topic Segments. The same method is used for every selected Data Block.
| Method | Starting unit | Short neighbouring units | Oversized unit |
|---|---|---|---|
| Automatic | Each paragraph: a blank-line block when the text has blank lines, otherwise each non-empty line | Packed into one segment while together they fit the token cap | Split into its sentences, packed the same way within the paragraph, then as below |
| Paragraph | Each trimmed, non-empty line, treated as a paragraph | Kept apart: at most one paragraph per segment | Split at the sentence boundary nearest its middle, repeatedly, then as below |
| Sentence | Each Unicode UAX #29 sentence | Kept apart: one sentence per segment | Split as below |
Automatic packs neighbouring paragraphs: it adds the next paragraph to the current segment while the segment still fits Max tokens, and starts a new segment when it would not. A paragraph is never cut to fill a segment, so every segment still begins and ends at a paragraph boundary. News articles, speeches and transcripts often have many one- or two-sentence paragraphs; packing them gives each segment enough context to embed well and cuts the number of segments several times (about 5 times fewer on a 26,000-article news corpus at 256 tokens), which makes the run much faster. A paragraph longer than the cap on its own ends the current segment and is split into its sentences, which are packed the same way within that paragraph, so an article stored as one long paragraph gives a few full segments rather than one per sentence.
Choose Paragraph when each paragraph should be its own observation (for example, short survey answers or social media posts stored one per line), and Sentence for sentence-level topics. Neither packs. In Paragraph mode a paragraph longer than the cap is cut at the sentence boundary nearest its middle, and each half again if it is still too long, so a long paragraph becomes a few similar-sized pieces that end at full stops.
A sentence that is still too long is split at the clause punctuation (commas, semicolons, colons, dashes) nearest its middle, repeatedly, so the pieces stay similar in size and end at natural pauses. Only a stretch with no usable punctuation is cut at the token cap, and a leftover of fewer than four tokens from such a cut is dropped. Segments with no letters or digits (a stray quotation mark or full stop) are dropped in every mode.
Automatic and Paragraph differ in two ways: Automatic packs short neighbouring paragraphs, and for text that uses blank lines between paragraphs it keeps each blank-line block together, while Paragraph starts a new segment at every line break. Sentence uses a language-independent Unicode boundary algorithm, so abbreviations may occasionally form a short segment.
Sets the maximum size of a Topic Segment in model tokens. The default is 256 and the allowed range is 32–256. Tokens may be complete words or parts of words, and the cap includes special tokens added by the embedding model. A smaller cap gives more local observations; a larger cap gives each observation more context. With Automatic, the cap is also how far short paragraphs are packed together, so a larger cap gives fewer, fuller segments.
All modes split over-cap text into non-overlapping source spans. Apart from the tiny leftovers and letterless segments described above, no text is discarded. Very small caps (such as 32 tokens) produce many short, fragment-like segments, which can make the number of topics unstable; 128–256 tokens usually gives more stable topics.
Sets the smallest number of Topic Segments a Topic can have. The default is 10 and the minimum is 2. A smaller value finds more, smaller Topics, which may be noisier; a larger value needs more segments behind each Topic. Changing this value needs a new Run.
Limits the largest number of Topic Segments one Topic can hold. Topic size counts segments, not documents. Leave it empty for Auto: sometimes one huge Topic swallows most of the corpus, so Auto steps in when one Topic is the main topic of more than half of the documents (a document's main topic is the one that covers most of its text). It then splits that Topic into smaller ones, and keeps the split only if most of its segments still belong to a Topic afterwards. A fixed value must be larger than Min topic size.
After a run with Auto, the empty field shows in grey the size Auto worked with: the cap it applied, or the size of the largest Topic when nothing was split. It tells you which way to go: a smaller Max gives more, smaller Topics, and a larger one fewer. Press Tab to fill it in and change it, or type a number.
After each run, the line under the settings shows the segment count and what Auto decided, for example one topic was the main topic of 83% of documents, so topics larger than 1,540 segments were split. When splitting would have left most of that Topic's segments without a topic, Auto keeps it and says so; try a fixed Max topic size then, for example a few thousand segments, and compare.
Controls the random steps of the run. The default is 0. The same seed always picks the same documents for each Data Block's sample and, with Topic sampling, the same segments.
Running again with the same seed and settings gives very similar topics, but not always identical ones: the step that maps segments before clustering spreads its work over all processor cores, and the order in which they finish can shift a few borderline segments, and occasionally add or merge a small topic. The main topics stay the same. To check how stable the topics are, compare runs with a few different seeds.
Topic sampling is off by default. When ticked, Wordflow finds the topics from a sample of Topic Segments picked at random with the Seed, then gives every other segment the topic of the sampled segment most similar to it (the nearest one by embedding cosine similarity). Every segment is still embedded and still gets a topic, or No topic when its nearest sampled segment has none, so document coverage and the bubble chart cover the whole corpus. After the run the summary line reads, for example, topics found from a sample of 100,000 (seed 0).
Segments to sample. The field shows a suggested size in grey. Run uses it as it is; press Tab to fill it in and change it, or just type your own number (at least 1,000). The note under the checkbox shows the sample, the estimated number of segments in the corpus, and what the sample may miss.
Why it can help. Clustering (HDBSCAN) compares segments with their neighbours, and its time grows with the square of the number of segments: twice the segments take about four times as long. With Automatic segments a corpus of 26,000 news articles makes about 107,000 segments, and clustering all of them takes under a minute. Corpora many times larger can take much longer, and that is where sampling saves time. When the estimated segment count is large, the note under the unticked checkbox suggests it.
What it costs. A topic must have at least Min topic size segments inside the sample to be found, so the smallest topic a sample can find is about Min topic size × (all segments ÷ sample size). With 107,000 segments, a sample of 20,000 and Min topic size 10, a theme needs about 54 segments in the corpus to show up. A thin sample also blurs the gaps between neighbouring themes, so they can merge into one large topic. Use the largest sample that runs in acceptable time, and compare two seeds to check that the topics are stable.
What it does not change. Embedding takes most of a long run, and every segment is still embedded, so sampling only shortens clustering. Embeddings are saved, so a second run on the same text (for example with another Topic size) skips embedding. Topic sampling is also different from Step 2's sampling percentage, which leaves documents out of the run: with Topic sampling no document is left out of the result.
Choose Run. The native pipeline constructs Topic Segments, embeds them with the configured sentence-transformer model, reduces the embeddings with PaCMAP, clusters them with HDBSCAN, calculates c-TF-IDF representative words, and saves the Result. The first run can be slower while model resources are loaded or downloaded.
Every mode uses this same downstream pipeline. Each Topic Segment is one equal clustering observation. When assignments are rolled back to documents, each segment is weighted by the Unicode-character length of its owned source span. Outlier coverage remains part of normalised Topic Coverage and can be dominant.
Settings are locked while Run works. After it finishes, Run turns on again only when you change a setting that affects the topics. Words per topic, stop words, search, selection, and chart controls only change what is shown, so they do not turn Run on. After a failure or a stop, Run stays off until you choose Clear; your segmentation method, token cap, and Min topic size stay selected. See How Preview, Run and Clear work.
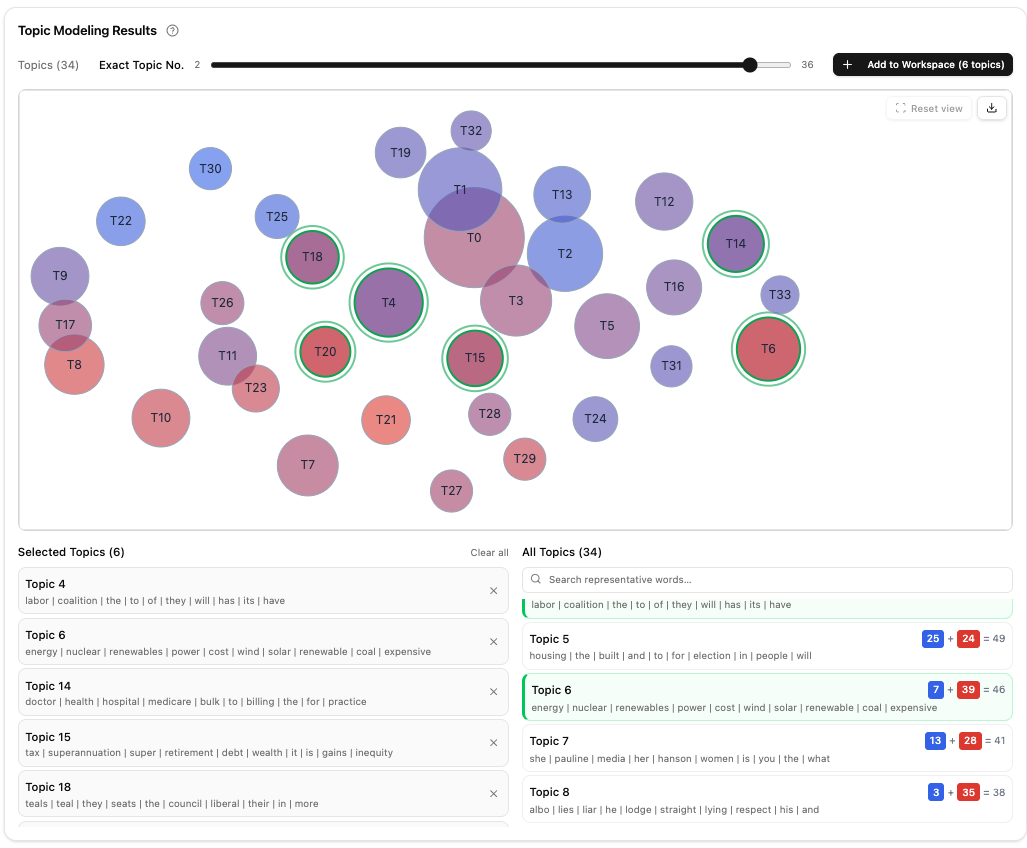
The Result settings row below the bubble chart holds Topics, Per document, Words, the stop word controls, and, for a single-corpus result, Colour by, with Add to Project at its right. Question-mark icons beside some of these controls give a short explanation. Below it, the Selected Topics and All Topics lists each have their own resize grip, like the chart itself.

The Result starts with the number of Topics the run found. Use Number of topics to merge them, down to one Topic, without running the analysis again. Segments that fit no Topic are marked No topic; they stay as they are and do not count toward the number shown. Results with zero or one real Topic show a fixed disabled control.
The lower bound appears to the left of the slider. Change the topic count with either the slider or the number field on its right; both stay synchronised. Wordflow updates the topics once you finish changing either control: when you release the slider, after a short pause in the arrow keys, or when you press Enter or leave the number field. The slider stays selected after each update, so the arrow keys can step the count again straight away. The current chart remains visible with Updating topics… until the new representative words, coordinates, sizes, and document assignments arrive. A failed request restores the previous value. Changing the count clears Topic selection and chart hover or zoom state. Search, stop words, and Words per topic remain in place.
A changed topic count is remembered with the result. If a lower cluster count cannot support the current Top topics per row, Wordflow sends one update with that value clamped to the new count. Running again starts from the natural count and Top 2. Export and Add to Project use the topics on screen and are unavailable while an update is pending.
Top topics per document controls how many of each source row's strongest positive real-topic shares contribute to bubble counts. The default is 2. Topic −1 and zero shares never count. If several Topics tie at the cutoff, all tied Topics count, so one row may contribute to more than this number and to several bubbles. The question-mark tooltip beside the control summarises this counting behaviour.
Enter a value and press Enter or leave the input to request one update. Partial input and the already-applied value make no request. Changing only this value updates bubble sizes, corpus composition, Topic lists, tooltip counts, CSV, and publication membership without moving the Topic layout or clearing selection, search, lasso filters, pan, zoom, or an open Add to Project dialog.
For a single-corpus result, Colour by colours the bubbles by a metadata column instead of the Data Block colour, so you can see, for example, which topics each party or decade talks about most. The list offers every column (other than the text column) with 2 to 8 distinct values among the analysed documents: text, true/false, or numbers. Each name is followed by its number of values, for example Country (3). A column with a single value is not listed, because every bubble would get the same colour. Values are read from the Data Block when you choose them, so columns added after the run, such as annotation columns, are included. Empty values form a grey (missing) group.
Each value counts the documents whose Top topics per document include the topic, the same rule as bubble size. To stop common values dominating, each count is divided by how many documents have that value, and the bubble blends the two values most over-represented in the topic, as in a two-corpus run. The hover card and topic list show every value's count and percentage (see Counts and percentages), a legend under the graph maps colours to values, and a downloaded graph includes that legend. Choose Data Block colour to return to the usual colouring. The choice is not saved and resets when you run the analysis again. No re-run is needed.
The blended colour shows the two values most over-represented in a topic, but not whether the topic is concentrated in those values or spread across all of them. Bubble opacity adds that: the more a topic is concentrated in a few values, the more solid its bubble; the more evenly it is spread, the paler. A topic from a single value is the most solid, and a topic spread evenly across every value is the palest.
Opacity comes from the topic's concentration, which is one minus Pielou's evenness:
- Each value's share: its count in the topic divided by how many documents have that value (as for the colour), then scaled so that the shares of all K values of the column add up to 1: p₁, p₂, …, pK.
- Evenness J = H ÷ ln K, where H = −Σ pᵢ ln pᵢ is the Shannon entropy of the shares (values with a share of 0 add nothing). J is 1 for a perfectly even spread and 0 when one value has everything.
- Concentration C = 1 − J.
- Opacity = 0.25 + 0.55 × √C, so it ranges from 0.25 (even) to 0.8 (one value). The square root spreads out the middle, where most topics are.
For example, with three values of equal size, a topic with counts 60, 58, and 10 has C ≈ 0.17 and opacity ≈ 0.48, while counts 60, 58, and 57 give C ≈ 0 and opacity ≈ 0.26. Hovering over a bubble lifts it above this range, and selected topics are marked by an outline, so neither changes what the opacity means. Without Colour by, every bubble uses the same opacity.
Words per topic controls how many representative words appear in the topic
list, search, and hover cloud. The default is 15 and the range is 3-100. Enable
the stopword filter to apply the Tab's saved list. Choosing a list from the
dropdown switches the filter on if it was off. You can edit the list while
filtering is off.
The dropdown's From other tabs group lists stop words saved in your other
Frequency or Topic Modelling tabs; Wordflow classic lists offers the built-in
lists earlier Wordflow versions used; Languages (stopword library) offers
default lists from the open-source stopword package: it shows the language
detected from the first selected Data Block, marked (Detected), and Show
all languages reveals the rest. Any choice appends its words to the
saved list (duplicates are skipped, so you can combine lists and keep custom
words), copied tab lists stay independent afterwards, and Clear stop words
empties the list. The menu returns to Saved list (N words) after a choice.
These controls change presentation without rerunning or refetching the
Result.
Each bubble is a discovered topic. Bubble size reflects source rows whose positive share for that Topic is within the displayed Top topics per document; in a two-corpus run, colour composition compares the Topic's share of each analysed corpus, then normalises those two shares for the colour blend. This prevents a larger corpus from dominating the colour solely because it has more rows. With two Data Blocks, a Bubble colour legend under the graph names each Data Block beside its colour, and the blend between them; downloads carry the same legend. A row may count in multiple bubbles, so bubble totals need not equal the source-row count. Nearby bubbles have more similar topic representations. Only closeness matters: left, right, up and down have no meaning, so the map is stretched to fill the chart area, from 2.5 times as wide as it is tall to 2.5 times as tall as it is wide, and is laid out again when you resize the chart. Bubbles may overlap, but positions are nudged apart just enough that no topic is hidden: the centre (and label) of the smaller of two bubbles always stays outside the larger one, the smaller bubble moves more, and bubbles stay as close to their original positions as possible. Smaller bubbles are drawn on top. Segments with No topic have no bubble. Topics with a total bubble count of zero are omitted from the graph but remain available in the Topic lists and Result data.
The hover card and the topic list show a topic's size as one coloured chip per Data Block, or per value when Colour by is on, followed by the total. Each chip has two numbers, for example 296 · 7.9%:
- The count is how many documents from that group are in the topic. These are the rows you get from that group when you add the topic to your Project.
- The percentage is that count out of all the group's documents in this run (after sampling). Hover over a chip to see both numbers, for example Senate: 353 of 2,871 documents (12.3%).
The percentages in one topic do not add up to 100%, because each one is out of a different group. A topic that every group talks about can hold 70% of each group's documents, and a small topic may hold 2% of each.
When Top topics per document is more than 1, one document can be in several topics. Then a group's percentages across all the topics can add up to more than 100%.
The bubble colour compares these percentages, not the counts. That is why a group with few documents can colour a bubble with only a few of them: 1 of 15 documents (6.7%) weighs about as much as 296 of 3,729 (7.9%).

Hover for a representative-word cloud. Word order reflects c-TF-IDF distinctiveness, while word size reflects occurrences in assigned Topic Segments. Because segments do not overlap, source tokens are not counted twice. These are not source-document frequencies.
Drag empty graph space to pan. To zoom, pinch on a trackpad, or hold ⌘ on a Mac (Ctrl elsewhere) while scrolling; a plain scroll scrolls the page, even over the graph. The graph initially
fits every bubble; use Fit view to restore that complete view after moving
around. Select topics directly, or enable the lasso control and draw around
several Topic centres. Lasso mode remains active and later strokes add to the
filter shown in All Topics; use Clear filter in the graph toolbar to
remove that accumulated filter without changing manually selected Topics.
Search further narrows the filtered list and fades the other topics in the
graph. A topic matches when the search text is found in its words; * (any
letters) and ? (one letter) match within a single word, so gs* and gs?
both find topics with gst wherever it is in their list. Click a topic in the chart or in All
Topics to add it to Selected Topics; the × removes it and Clear
removes them all.
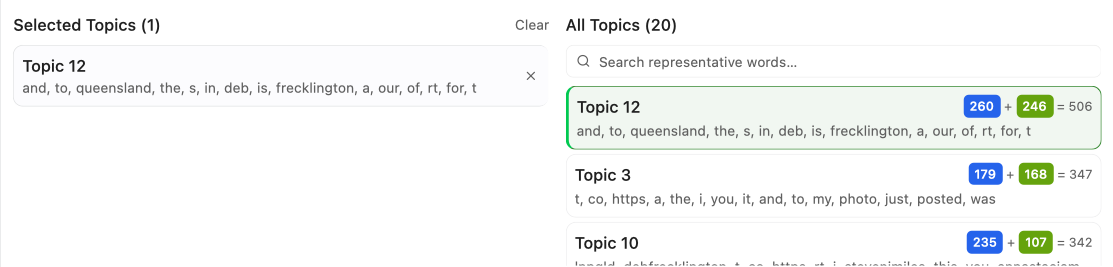
Choose Add to Project to publish
manually selected topic data and linked topic meanings as new Data Blocks.
For a two-source result, Sync columns applies exact, case-sensitive shared
source-column selections to both checked Data Blocks. Enabling it combines the
currently selected shared names; individual choices and Select all or
Select none then update both sources. Source-only columns are disabled while
sync is active, and an unchecked source keeps its independent selection.
TOPIC_top1 remains required and is not synchronised. If fewer than two sources
remain checked, Sync columns turns off automatically. When the source Data Block
was itself made by Topic Modelling, its old TOPIC_ columns are not offered: the
new ones replace them. A TOPIC_ column cannot be the text to model, because it
holds topics from an earlier run rather than documents; Wordflow says so.
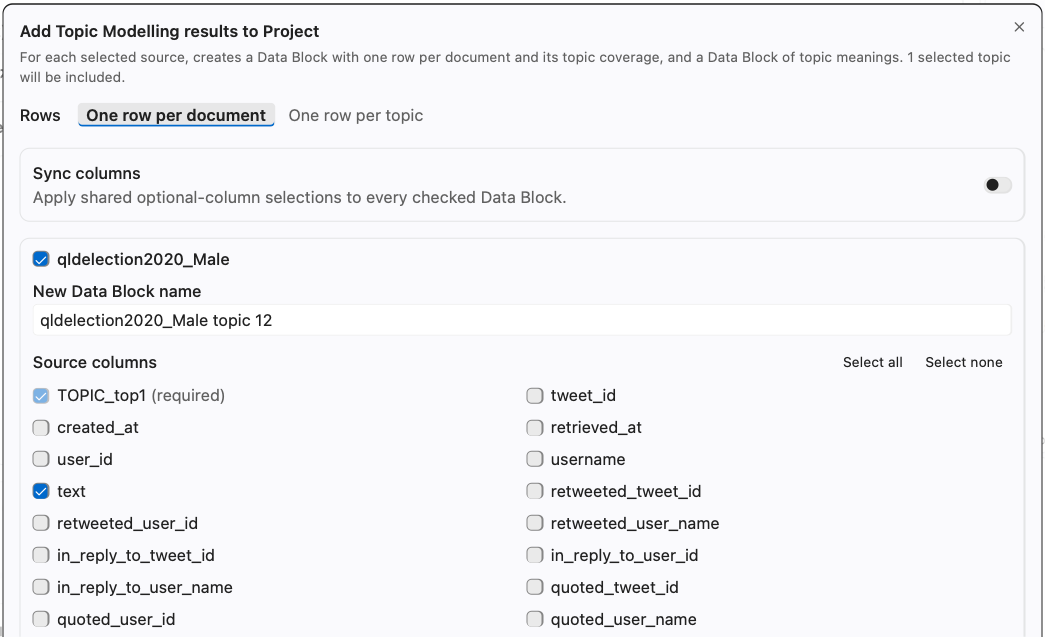
The Rows choice in the dialog sets how rows are formed:
-
One row per document (default): one row per source document, with its dominant topic (
TOPIC_top1) and full topic coverage (TOPIC_coverage).Most tools cannot use the
TOPIC_coveragecolumn yet. Analyses leave it out of the metadata they show and carry; in the Data Builder only Filter can use it (to keep rows by a topic threshold), and in the Data Editor it can only be duplicated, renamed, or deleted. CSV and Excel exports write it as text; Parquet keeps it as it is. -
One row per topic: one row for each topic in each document. The document column holds only the segments assigned to that topic, joined by line breaks in source order, so a document with three topics becomes three rows. Each row also carries the topic (
TOPIC_topic), its share of the document's text (TOPIC_share), and how many segments it joined (TOPIC_segment_count). Segments with no topic are left out. Use this when you are interested in particular topics rather than whole documents.
The suggested name for each new Data Block includes the selected topic numbers, for example Corpus topic 5 or Corpus topics 3, 7 (with more than three topics selected, Corpus 8 topics). One row per topic names end in segments, for example Corpus topic 5 segments. You can edit the name before adding it.
Both modes use the topics as currently shown, including any merging from Number of topics. One row per topic needs a result from this version of Wordflow; for older results, re-run the analysis first.
The download control exports the current panned and zoomed graph viewport. Its header records Data Block, cluster count, Top topics per document, random seed, and Topic count. CSV output still contains every topic and its current counts.
Choose Interactive HTML to save the graph as one web page that opens in any browser, offline. It shows the graph exactly as on screen (positions, colours, selection rings and faded topics) and keeps three things to explore: hover a bubble for its words, sized by count, and the same size chips as the app (per colour-by value, or per Data Block); type in Find topics to highlight matching topics, with the same rules as the app's search; and drag to move, or hold Command (Mac) or Control (Windows) while scrolling to zoom. Once zoomed in, plain scrolling moves the graph in any direction; at full size it scrolls the page. Reset view returns to the whole graph. The last line links to the Wordflow home page. It cannot change the topics or add anything to a Project.
Clear removes this tab's result. The selected Segments method, Max tokens value, and Topic size range remain available for the next run.
| Symptom | What to try |
|---|---|
| Almost all segments have No topic | Increase sampling, try another segmentation method, or check whether the corpus has shared themes |
| Topics change substantially between runs | Increase sampling and compare runs with fixed seeds |
| Representative words describe formatting rather than subject matter | Clean boilerplate or choose a segmentation method that better matches the document structure |
| A structural unit becomes many segments | Increase Maximum tokens per segment or choose a coarser segmentation mode |
| Run time is very long | Use Automatic segments with a larger Max tokens, try Topic sampling, or reduce the per-Data-Block sampling percentage |
| Setting | Default |
|---|---|
| Sampling | 100% per Data Block |
| Segments | Automatic |
| Max tokens | 256 |
| Topic size | 10 to Auto |
| Seed | 0 |
| Topic sampling | Off; suggested for very large corpora |
| Per document | 2, or the available Topic count when smaller |
| Words | 15 |
- Run a corpus with Automatic segmentation.
- Change Top topics per document and compare bubble membership without moving the map.
- Move Number of topics down and compare the merged representative words.
- Clear the Result, choose Paragraph or Sentence, and run again with the same sample and seed.
- Compare the topic map, representative words, and how many segments have No topic.