Repository navigation
perf: a detected_level filter before json reads the stored level fields, matching Loki - #795
Conversation


 github-actions
Bot
added
size/XL

… level fields

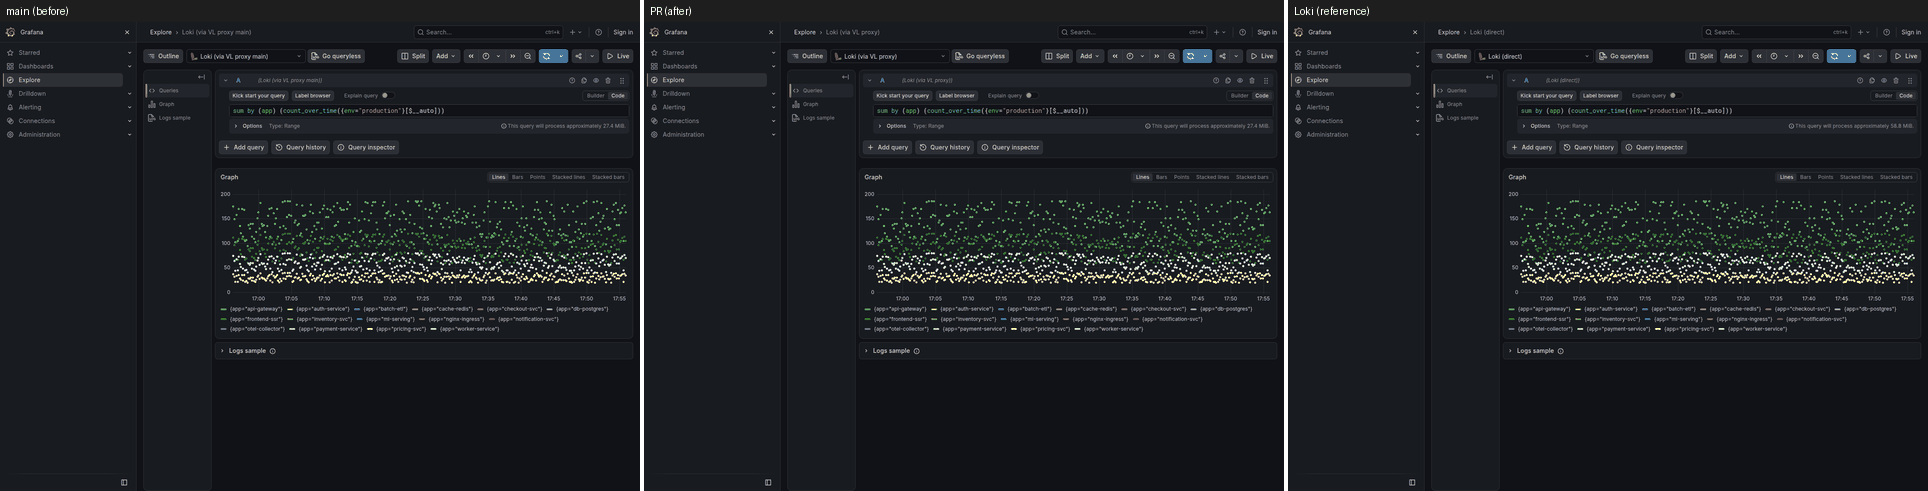
The Explore logs volume with a level selected
(`sum by (level, detected_level) (count_over_time({...} | detected_level="info"
| json | drop __error__ [1m]))`) rendered the filter before the parser as a log
query does, `| unpack_logfmt | filter level:="info"`, so VictoriaLogs parsed every
row of the window as logfmt in the stats query and in each parse-risk probe, and
a `level=` token of a message overwrote the stored level. Lines were counted
under the wrong level in both directions: a line in an info stream whose body
said level=error was dropped from the info count, and a line in a debug stream
whose body said level=info was counted as info.

detected_level is assigned at ingest and `| json` cannot change it, so the
filter keeps the same lines before the parser as after it. The ordered-JSON
metric route, range and instant, now applies a filter on detected_level before
the first parser like the one after it: from the stored level fields, or the
level chain when they do not decide, with the stats pushdown kept. The stats
query starts from the selector and the line filters, the parse-risk probes run
on the selector plus the stored-level filter, and the raw-row evaluator, when a
probe sends a window to it, fetches the same narrowed rows and applies the
filter to the level it derives for each.

Plans with `| logfmt`, the route that skips `| json` when it cannot affect the
aggregation and the native Drilldown histogram still render the filter as the
logfmt unpack. With -detected-level-body-scan=false a plan that reads the level
only in this filter keeps the translator's rendering on the stats path; a plan
that also groups by level or detected_level, and any window the raw-row
evaluator answers, use the stored-level filter and a level derived from the
stored fields only. Other label filters before the parser and the translator's
log-query rendering are unchanged.

da0b9c8 to
25988a0
Compare
github-actions
Bot
added
size/XL

🟢 Performance A/B: faster, no regression77 shape×range — 1 🟢 faster · 76 ⚪ same · results vs Loki: 62 same, 0 new difference(s), 15 pre-existing
¹ re-measured with 7 runs, on windows the first pass did not use, after it moved beyond noise. 76 unchanged shape×range (within noise)
Cold (first-run) timings — what a user opening a panel sees
† Loki's own counters say its results cache answered this cold run: not a computed time. ↺ Loki cold taken from the first set that ran the same query; Loki's cache answered this one. Why these shapes
base |
PR Quality ReportCompared against base branch Coverage and tests
Compatibility
Performance smokeLower CPU cost (
State
|
✅ Visual smoke: passedBase
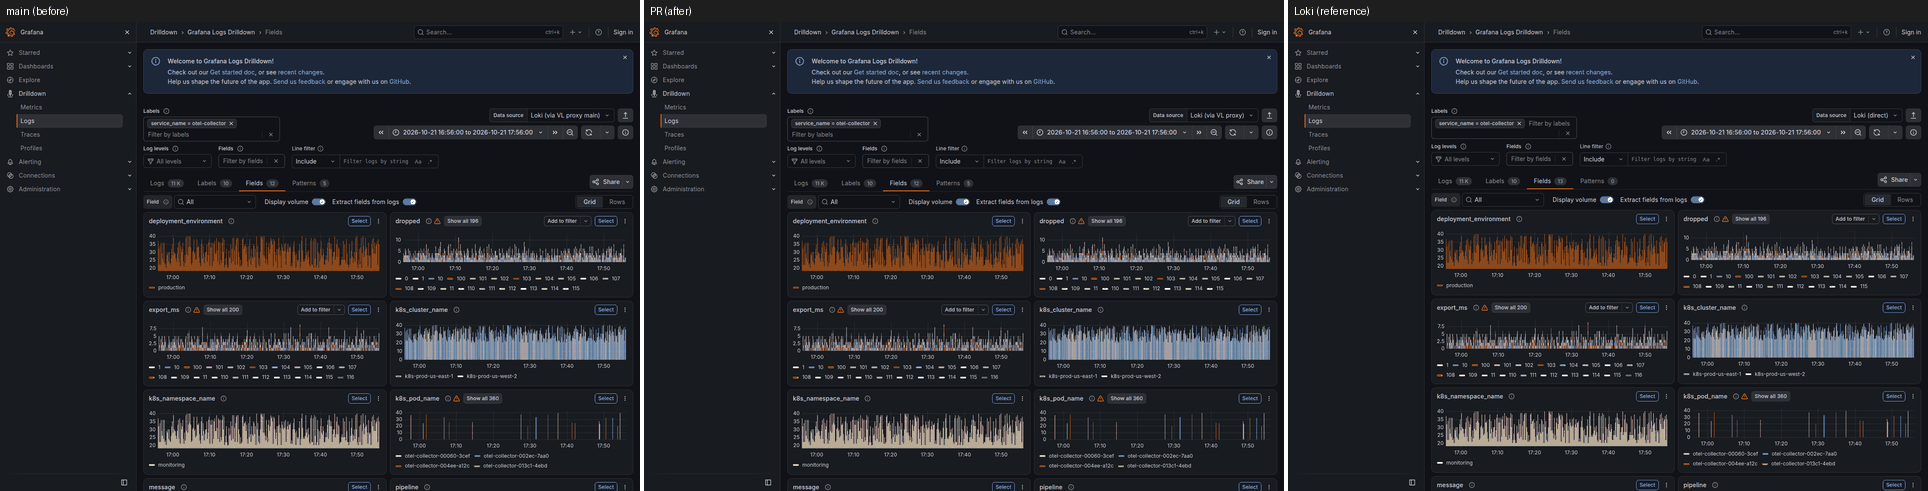
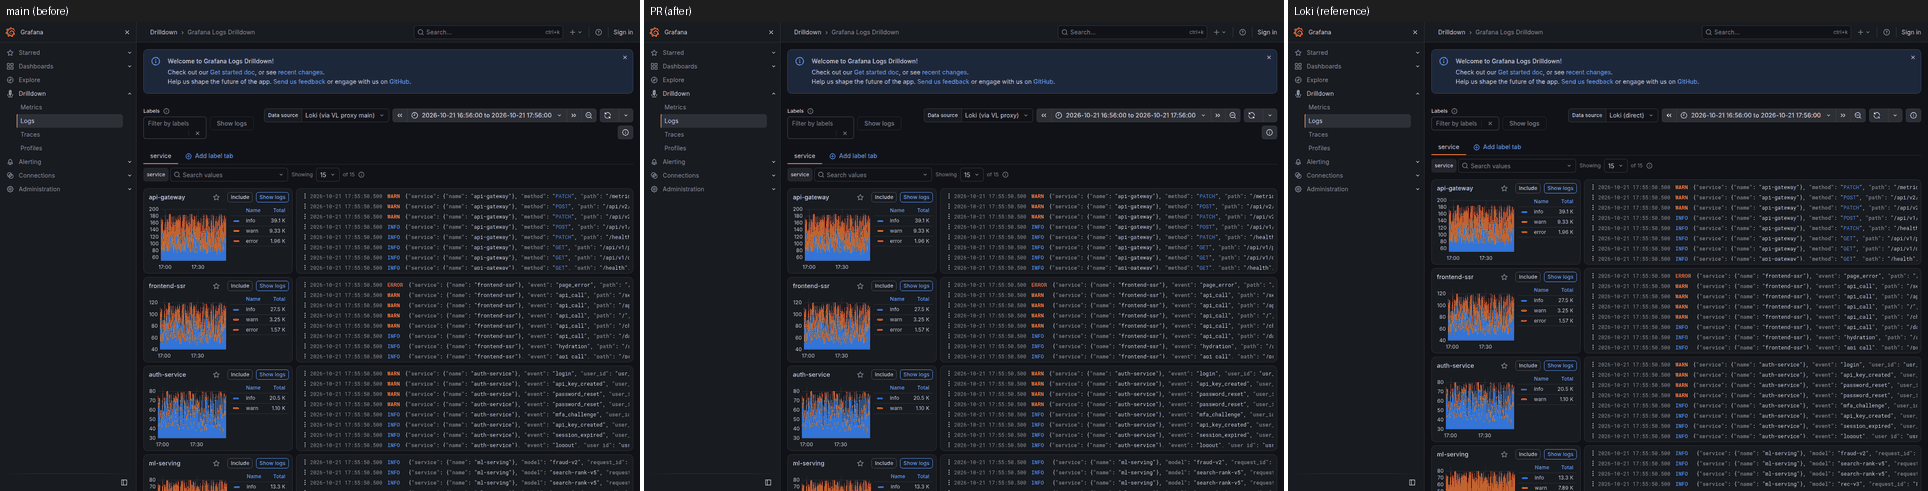
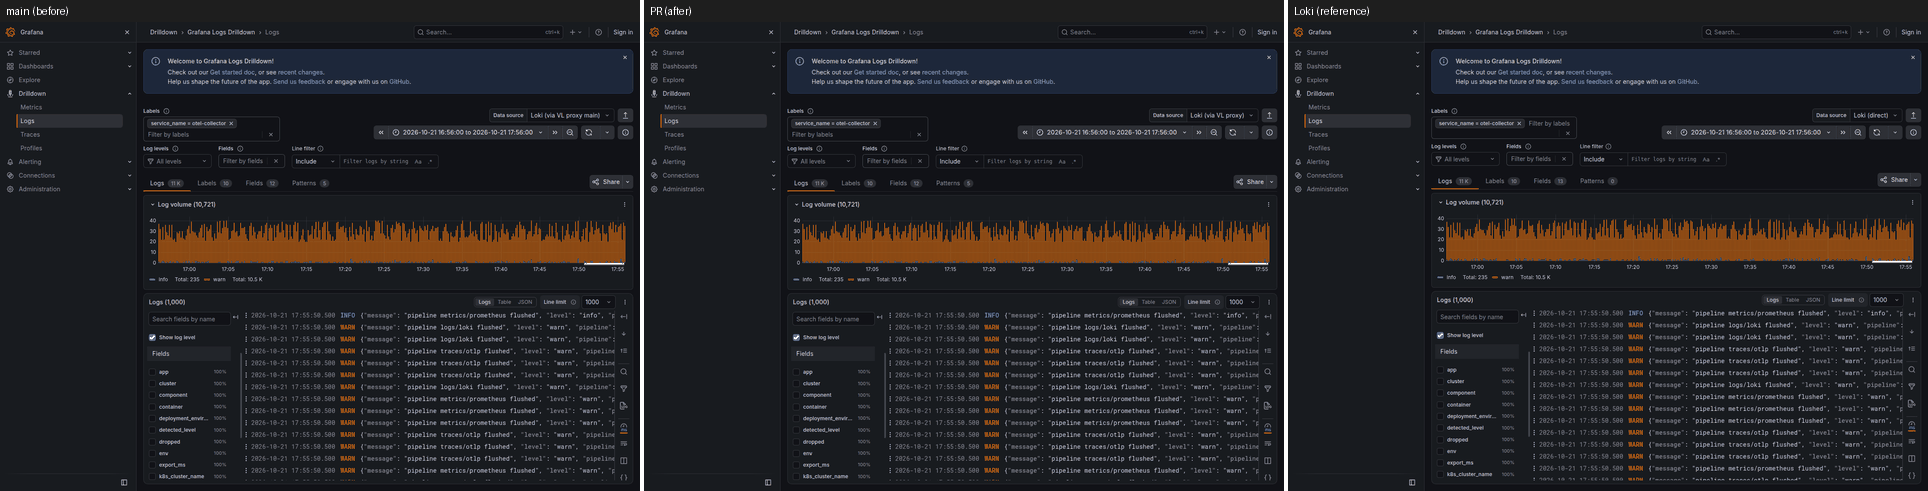
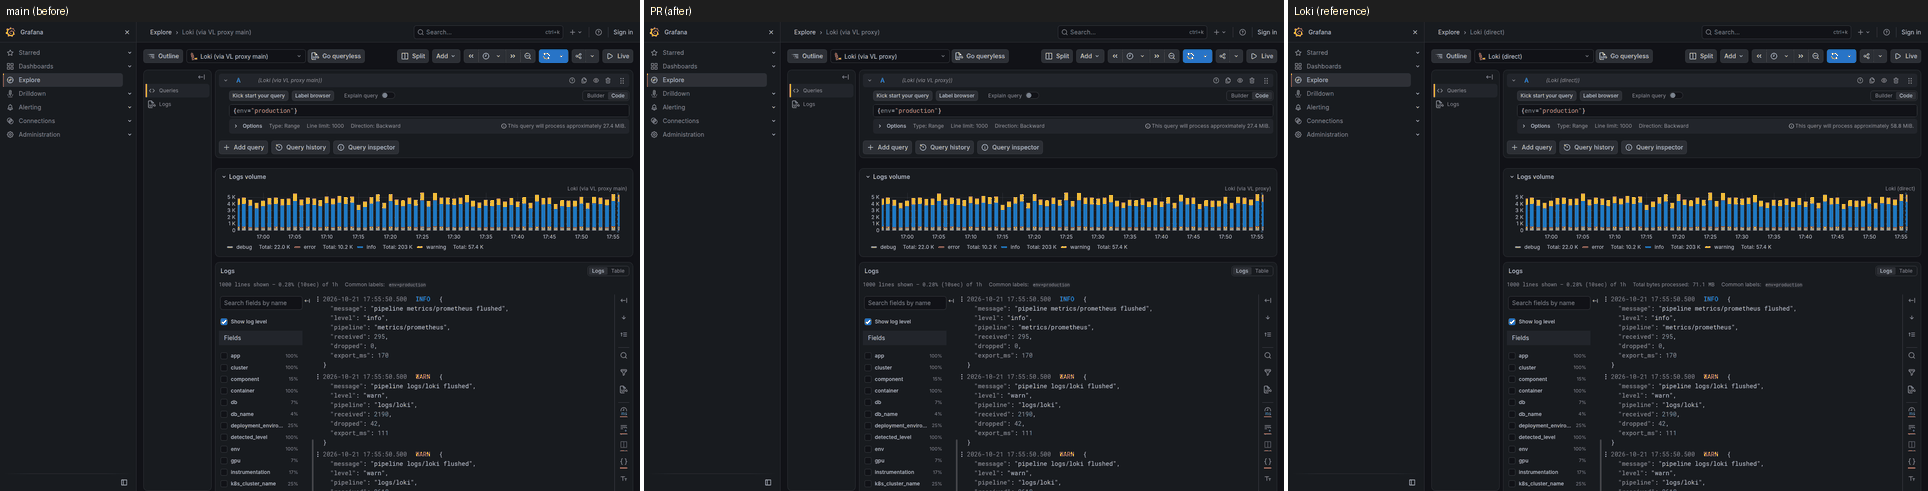
Gate: a base-vs-PR data difference passes when the PR is closer to Loki, and fails when the PR diverges from Loki or Loki cannot decide it (at a range Loki does not hold, a difference passes when the same page proved it closer to Loki at a shorter range; otherwise label the pull request Core set montages (5): base | PR | Lokidd-fields-1h
dd-landing-1h
dd-service-logs-1h
explore-logs-plain-1h
explore-metric-plain-1h
All montages of this run: |
The release workflow could not create the metadata branch for v2.24.1
(it was cut from #794 while main had already moved on). Materialize the
published 2.24.1 notes as the [2.24.1] section (#792's CI entry and
#794's Security entry, exactly as released) and set the chart to 2.24.1;
[Unreleased] keeps the entries merged since (#795, #796, #797).

Co-authored-by: szibis <szibis@users.noreply.github.com>
1 participant

Summary
Grafana Explore's logs volume with a level selected,
sum by (level, detected_level) (count_over_time({env="production"} | detected_level="info" | json | drop __error__ [$__auto])), was slow and miscounted.Cause: the translator rendered the
detected_levelfilter before the parser as| unpack_logfmt | filter level:="info". That unpack overwrote the storedlevelfield before the stats query read it, which caused two errors pulling in opposite directions:level=errororlevel=warnwere dropped, and so were lines whose level comes only from a JSON body or from a stored spelling such asInformation;level=infowere counted as info.Fix: the filter now stays out of the pushdown query. The stored-level filter and the stored level fields decide the level, and rows without a stored level go to the level chain. The answer matches Loki, and the shape is several times faster. At 7d it answers where main timed out.
Changes
internal/proxy/ordered_json_metric.go: the ordered-JSON route (range and instant, one or severaldetected_levelfilters before| json) keeps the filter out of the pushdown query and reads the level from the stored fields.| logfmtplans;withoutJSONnative route (for examplesum(count_over_time({...} | detected_level="info" | json | drop __error__ [1m])), orsum by (app)withappin the selector);-detected-level-body-scan=false:levelordetected_level, and any window the raw-row evaluator answers, uses the stored-level filter and a level derived from stored fields only.ordered_json_filter_pushdown_test.go):detectedLevelFilterFixturenow includes a stored-debugstream whose body sayslevel=info;TestOrderedJSONDetectedLevelFilterBeforeParserIgnoresMessageLevelTokenasserts info=3 and debug=2 with no raw rows. It fails on main, which gives info=2 and error=1;TestOrderedJSONDetectedLevelFilterBeforeParserTwoFiltersAndInstantcovers two filters, with and without stored levels, on range and instant.semantics/detected-level-filter-before-parser-pushdown;label-filter-before-parser-pushdownandparser-error-and-label-collisionare qualified; translations and reports are regenerated.Proofs
Base
ee900031(main before #790; there is no proxy code change between it and the current main). Branch rebased onto4a872d66with only the CHANGELOG in conflict.e2e vs Loki 3.7.7. Fresh isolated stack per run, compared with main by test name; VictoriaLogs restarts 0 → 0 in every run:
The two core failures are one vmauth backend-version subtest on the local stack, identical on main.
A/B with Loki at 1h (
bench/ab/pr_smoke.py, VictoriaLogs v1.52.0, refresh mode on). 77 shapes; none slower beyond noise; 0 new differences from Loki (62 same, 15 pre-existing on main too):A/B at long ranges. VictoriaLogs only, 7 days seeded (607,860 s, 8-day retention), VictoriaLogs at 2 CPUs; 58 shapes, none slower:
DL1–DL4, the json-filter-pushdown set and the control set all stay within noise. DL3 at 7d returns 502 on both builds.
Locally, Loki is OOM-killed by a 24h backfill. For a Loki reference at 24h, the daily run measures this shape at 52 ms warm and 4.19 s cold.
Grafana range matrix. Grafana 13.2.3, 47 pages (46 plus the fix-proof page) at 5m, 15m, 1h, 6h, 24h and 7d, plus Live tail. VictoriaLogs holds 7 days (48,253,273 lines); Loki holds the last 1.5 h. Main and branch are identical everywhere except four page groups:
explore-DL6: at 5m, 15m and 1h main differs from Loki on the info/info series (for example 442 against Loki's 444), while the branch matches Loki exactly. At 6h–7d the branch's values differ from main's in the same way.dd-fields7d andexplore-extracted-filter-metric7d: one-sided requests and an unsettled 7d capture (the known Grafana breakdown and timeout behaviour).explore-logs-plain24h/7d: the label list differs on the Grafana side, depending on earlier captures. Queried directly with identical requests,/labelsreturns the same 15 labels on both builds.Against Loki: 0 new differences across all pages.
Fix proof, the Explore volume with
detected_level="info"before| json(main, branch, Loki):benchstat. 19 benchmarks covering ordered JSON, detected_level and stats, 10 interleaved rounds,
GOMAXPROCS=4: no significant change (time geomean −0.09%, B/op −0.05%, allocations identical).Load test. 8 clients, 240 s, the control, DL6 and json-filter sets, 7 days of data, a fresh proxy per build; two runs:
/labelsThe heavy 7d shapes saturate this stack on both builds, so the 504s and the 429s appear on both, and the RSS peaks swing in both directions between runs. There is no consistent difference and no steady-state growth. The stats path buffers nothing new: its group-by fields are the same as main's, the level filter now runs inside VictoriaLogs, and responses are capped at 64 MiB.
Unit and gates:
GOMEMLIMIT=3GiB GOMAXPROCS=4 go test -short -p 1 ./...: 13/13 packages, peak RSS 1.54 GB;-raceon the touched tests (117);go vet(including the e2e tag), golangci-lint 0 issues;Follow-ups, not in this change:
-manual-range-metric-row-limitsooner;